Actual Expected Analysis
The Actual/Expected (“A2E”) model within the Portfolio Management module enables you to review the maturity performance of a Portfolio over time. It simulates the expected performance of the Cases in the Portfolio from a specified date onwards, using ClariNet LS’s Monte Carlo model. The results of the Monte Carlo simulation – the “expected” values – are displayed either as realized Net Death Benefit or deceased lives. The “actual” values are displayed on the same basis and are derived from Maturity Proceeds and Dates of Death entered. The results of the model are displayed graphically on the page and can be exported as an Excel file.
Note that the model only considers the Maturity Proceeds arising from matured Cases and does not include Premium Payments or Fee Payments. It cannot therefore be used to analyze total return or total cashflows; that can be done using the Portfolio valuation model.
Opening the A2E Model
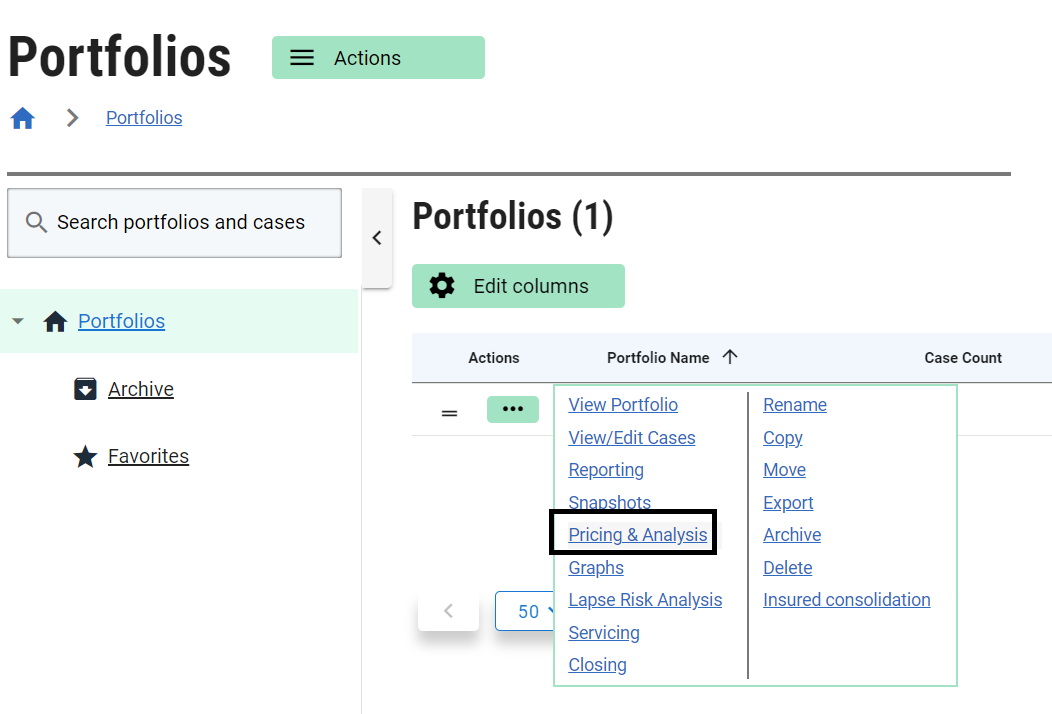
The A2E model is launched by clicking on the Pricing & Analysis sub-menu for a selected portfolio on the Portfolios page.
Next, select the ACTUAL EXPECTED tab.
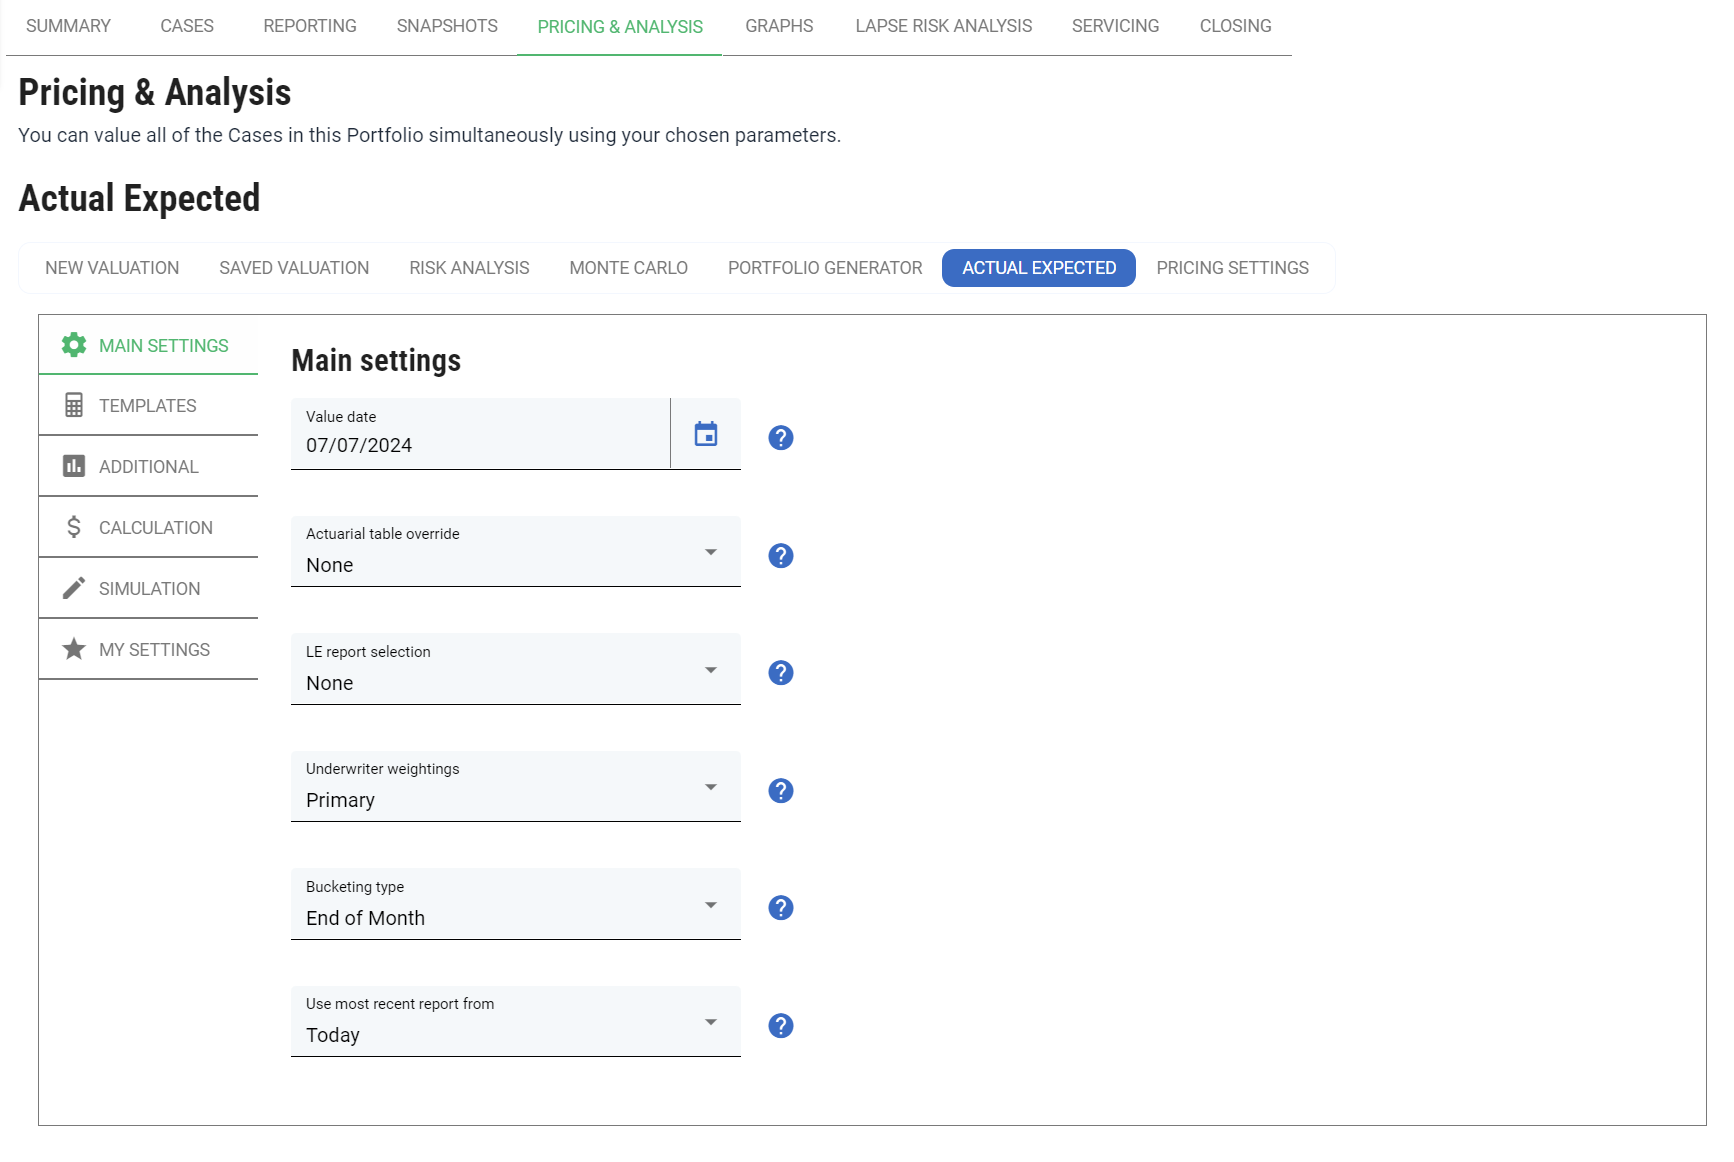
Valuation Parameters
The Parameters are similar to the equivalent sections on the Portfolio Valuation page. The differences are:
- The Value Date specifies the date on which the simulation begins. If you wish to simulate the performance of the Portfolio since inception, then select a Value Date which is on or before the first Purchase Date for all Cases in the Portfolio.
- Under calculation settings, you can choose the calculation type to be Monte Carlo or Durational Probabilistic.
- Accrual rate: the rate used to accrue interest on cashflows as they are bucketed. The impact of this parameter depends on the bucketing type.
Durational Probabilistic A2E analysis recalculates the expected mortality each month using the LE report which is active that month (this may be based on the LE weighting history). This approach differs from Probabilistic A2E analysis, which calculates a survival curve on purchase date and calculates mortality as the change in survival rate. When this analysis type is used, all references to Monte Carlo on this page are not relevant.
Simulation Parameters
This section is similar to the Simulation Parameters section on the Monte Carlo page.
Additional settings
A checkbox marked “Use purchase date” is added. If this is checked, the A2E model starts to model each Case from its Purchase Date (where that Purchase Date is later than the Value Date – otherwise it uses the Value Date). This option better reflects the performance that would be expected from a Portfolio acquired over some time.
Running the Model
After setting the Valuation Parameters and Simulation Parameters, click Generate. The model determines a random Date of Death for each Case in the Portfolio deterministically, based on a survival curve calculated using the LE Reports selected in the Underwriter Weightings. The Number of Simulations determines how often this is done. The results of each simulation and each Case are blended to produce an expected evolution of Net Death Benefit for the Portfolio as a whole – starting at zero on the Value Date.
Simulation Results
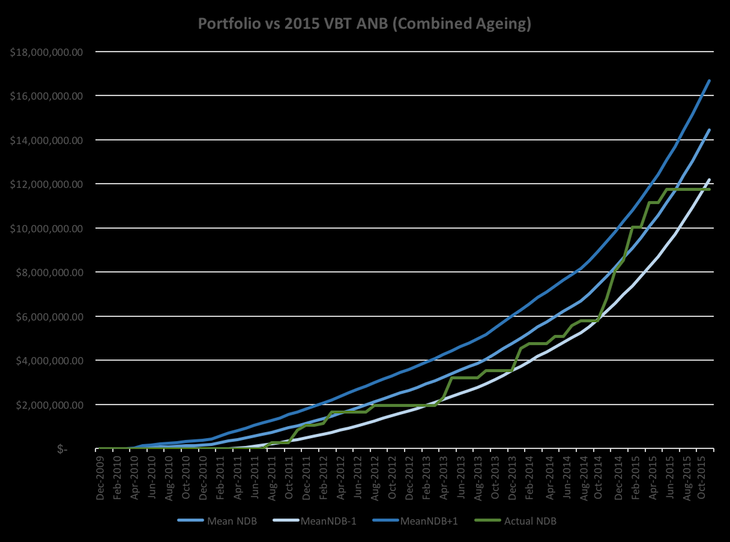
The results of the model are displayed as a graph on the page, based on either Net Death Benefit or Policy Maturities:
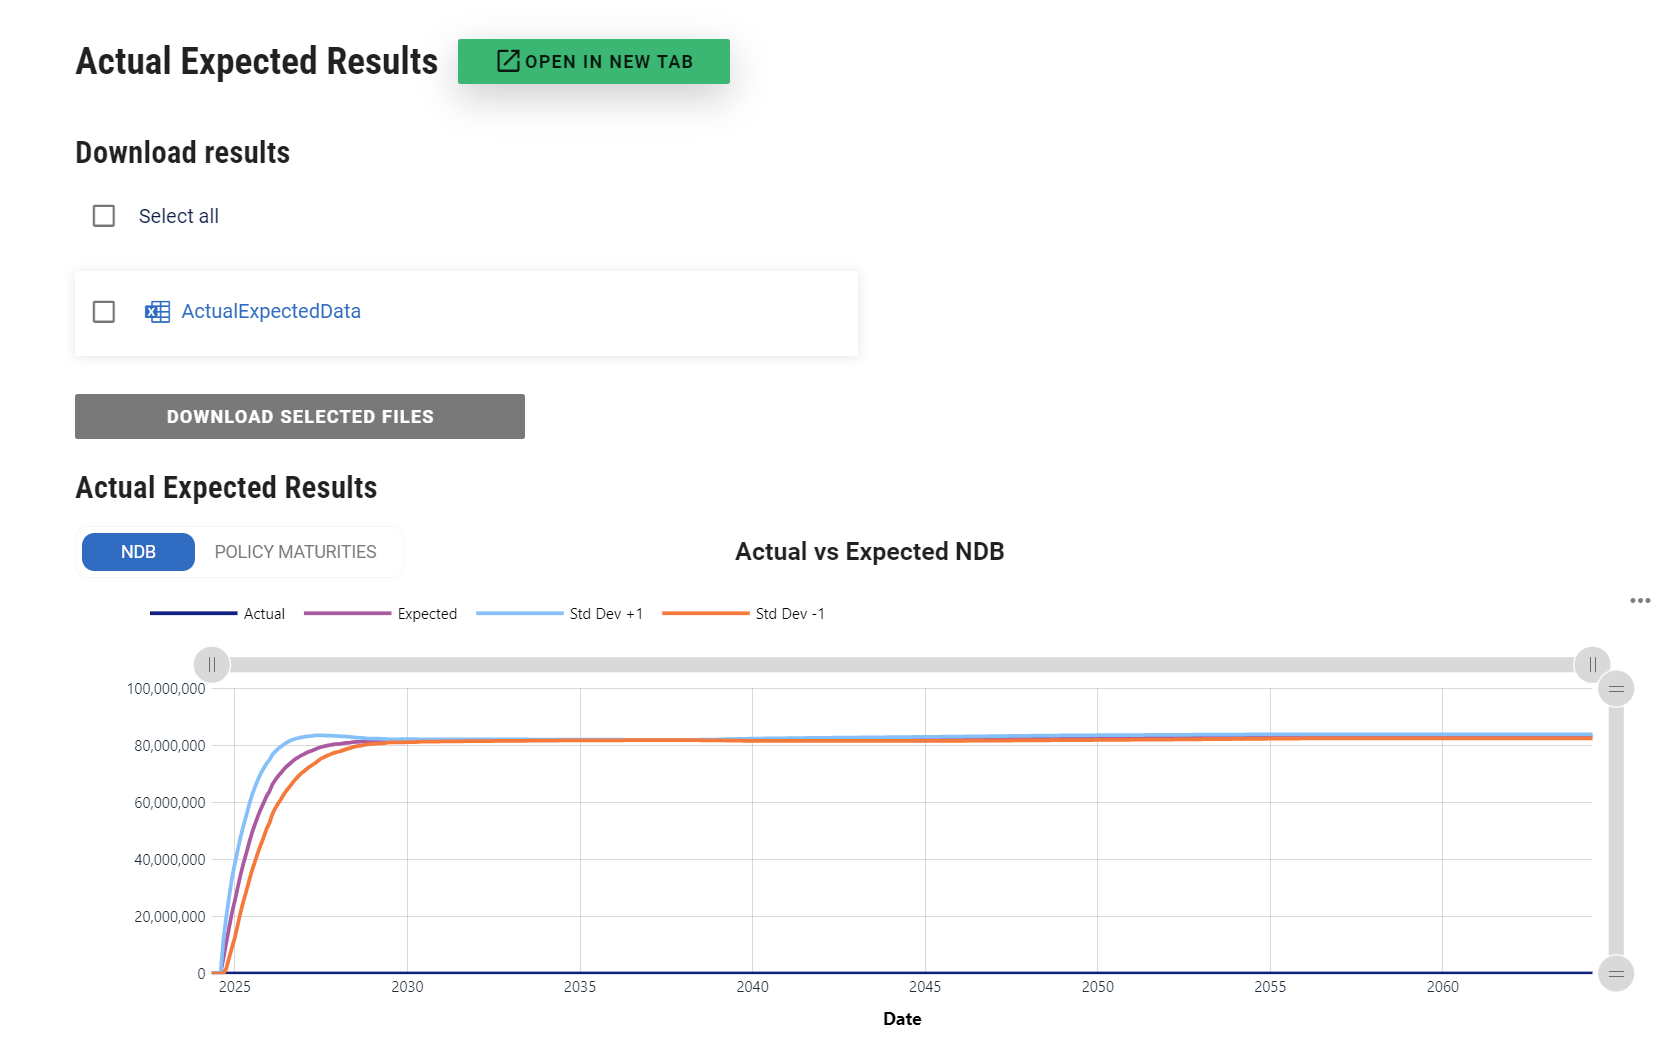
The actual value is shown as a dark blue line, with the mean expected value shown in red. To assist you in estimating the degree of outperformance/underperformance, the graph includes lines representing one standard deviation above (green) and below (orange) the mean.
Note that the actual value is drawn from the Maturity Total Amount figure for each Case for which the Status is “Maturity Claim Paid”. The Maturity Total Amount includes Net Death Benefit, Interest, Return of Premium and any other items specified, so in the majority of cases it will exceed the Net Death Benefit of the Policy. Cases with a Status of “Maturity Claim Pending” are not included in the actual value.
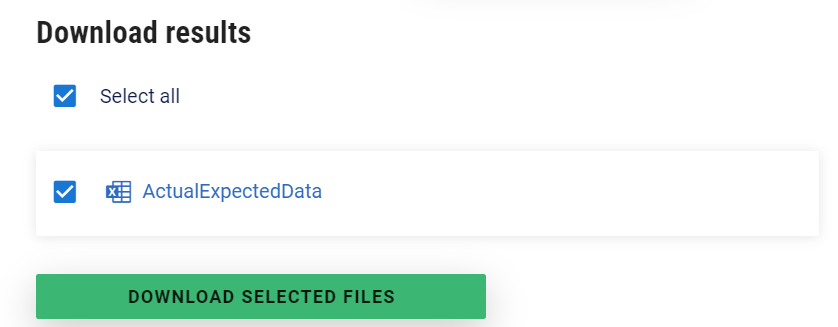
Download Results
If you wish to conduct further analysis on the figures, you can download the A2E results by clicking on the download button.
With a little work in Excel, you can generate a more detailed view of different parts of the A2E results: