Monte Carlo Decile Report
Overview
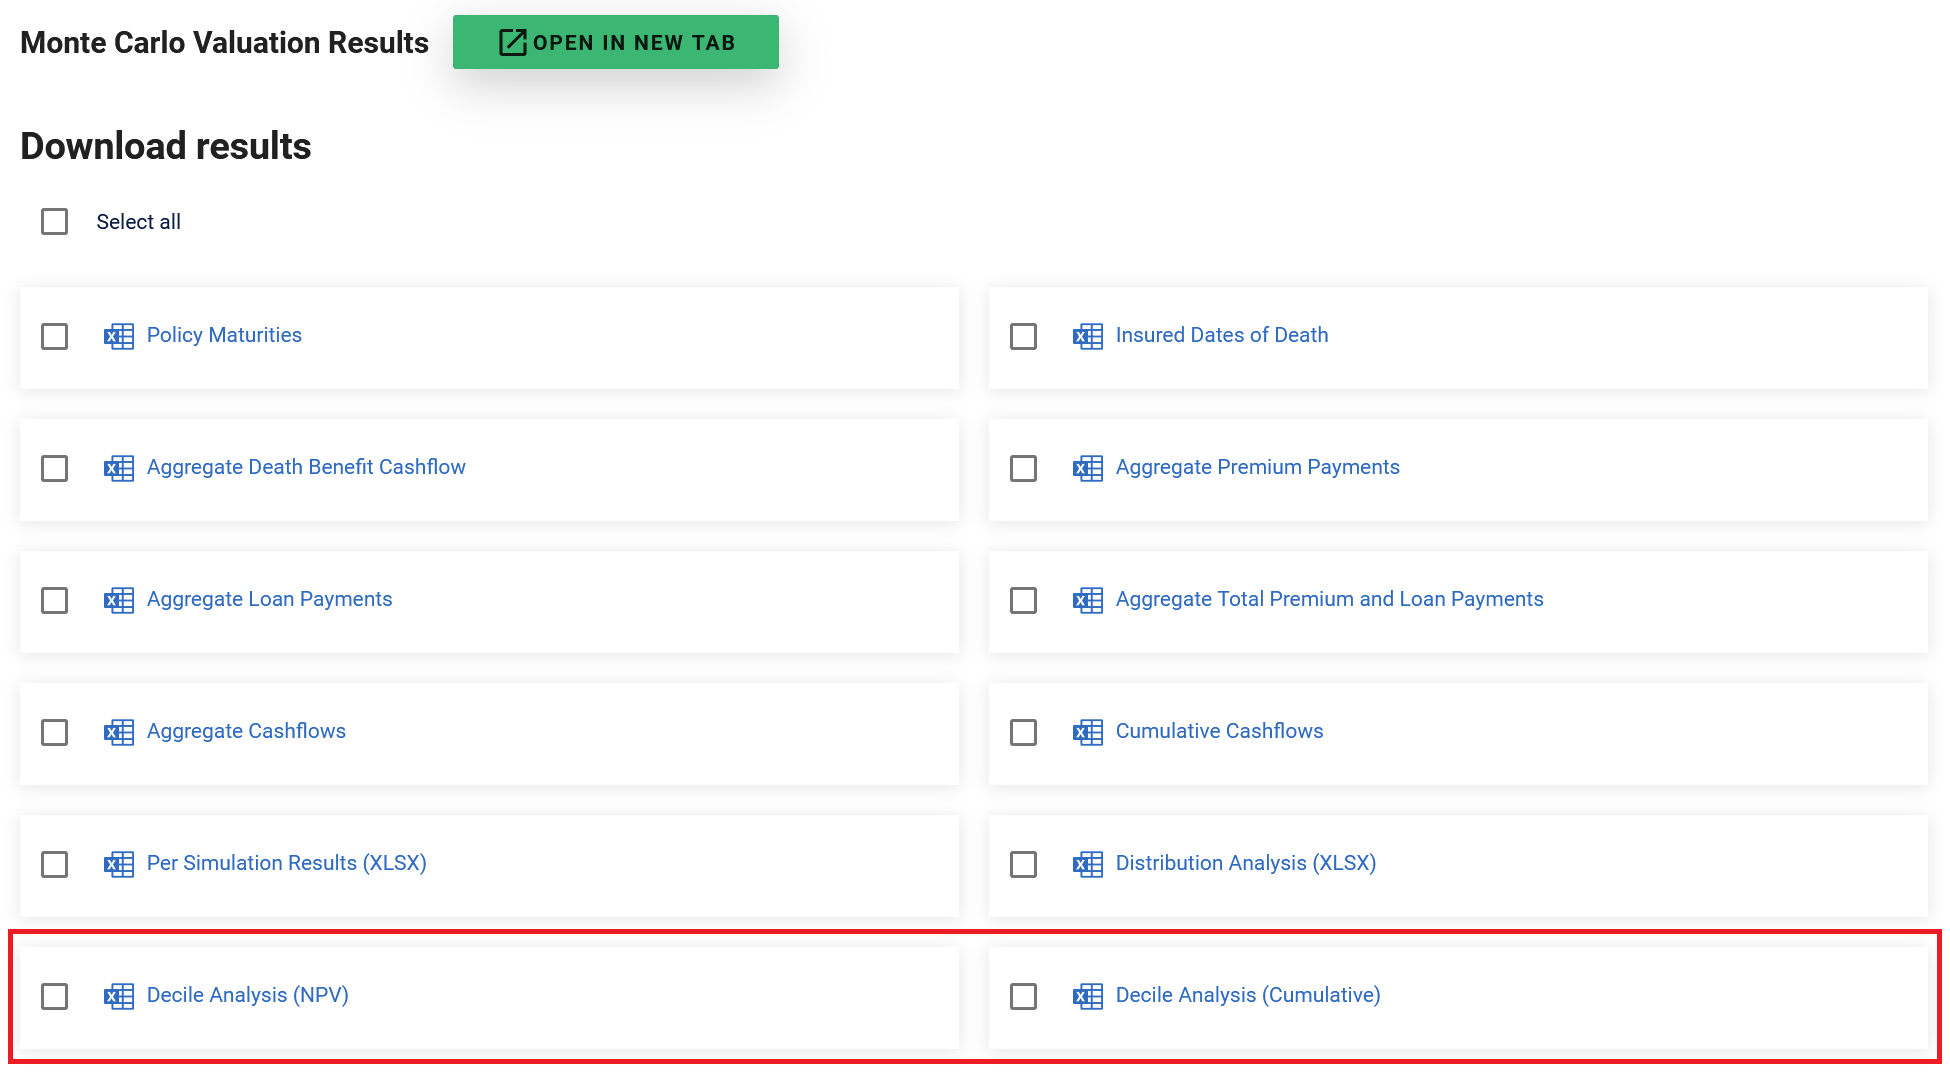
There are two reports available on the Monte Carlo screen in ClariNet which give detailed analysis of the monthly Monte Carlo simulation results, specifically the cashflows each month at multiple points on the distribution.
NPV Versus Cumulative
The results take two forms:
- NPV: this report takes all the Monte Carlo simulation draws and orders them by portfolio NPV.
- Cumulative: this report takes all the Monte Carlo simulation draws in each month and orders them by total cashflows.
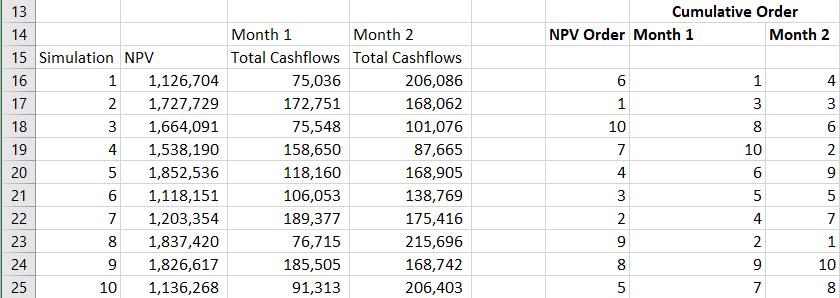
The key difference between these two reports is that the order of simulation draws that’s used in the distribution changes each month.
A simplified example:
Results Example
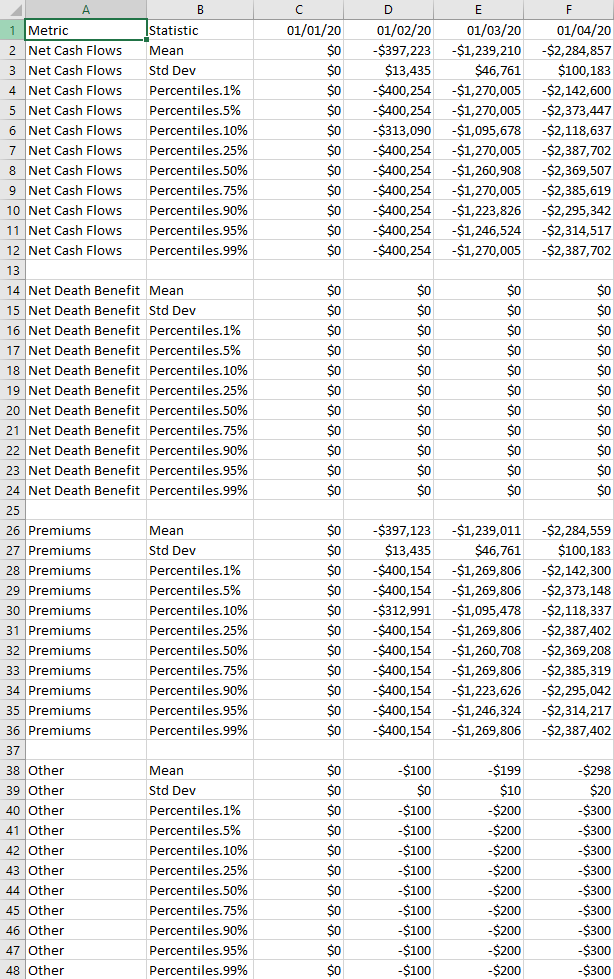
The results are split into 4 sections with the total cashflows first and then the subsets below. The flows marked “Other” are any flows that don’t fit into Death Benefit or Premiums; this includes Fees, loan payments and cash withdrawals.
Within each section you will see the Mean, Standard Deviation and the points from the distribution at that point in time. For the NPV sorted report, the percentiles will show a single Monte Carlo run all the way across in time since the ordering is fixed. For the Cumulative run, the percentile might have selected a different Monte Carlo trial at each date.
Both reports can sometime give counter-intuitive results, for example, where a higher percentile shows a lower premium. This is because the ordering is not separate for each cash flow type, so there can be cases where the NPV or Total Cash Flow ordering at a point in time leads to premiums being “the wrong way round”.
The results of the Decile Analysis can be verified by looking at the other Monte Carlo result downloads and manually sorting simulation runs.