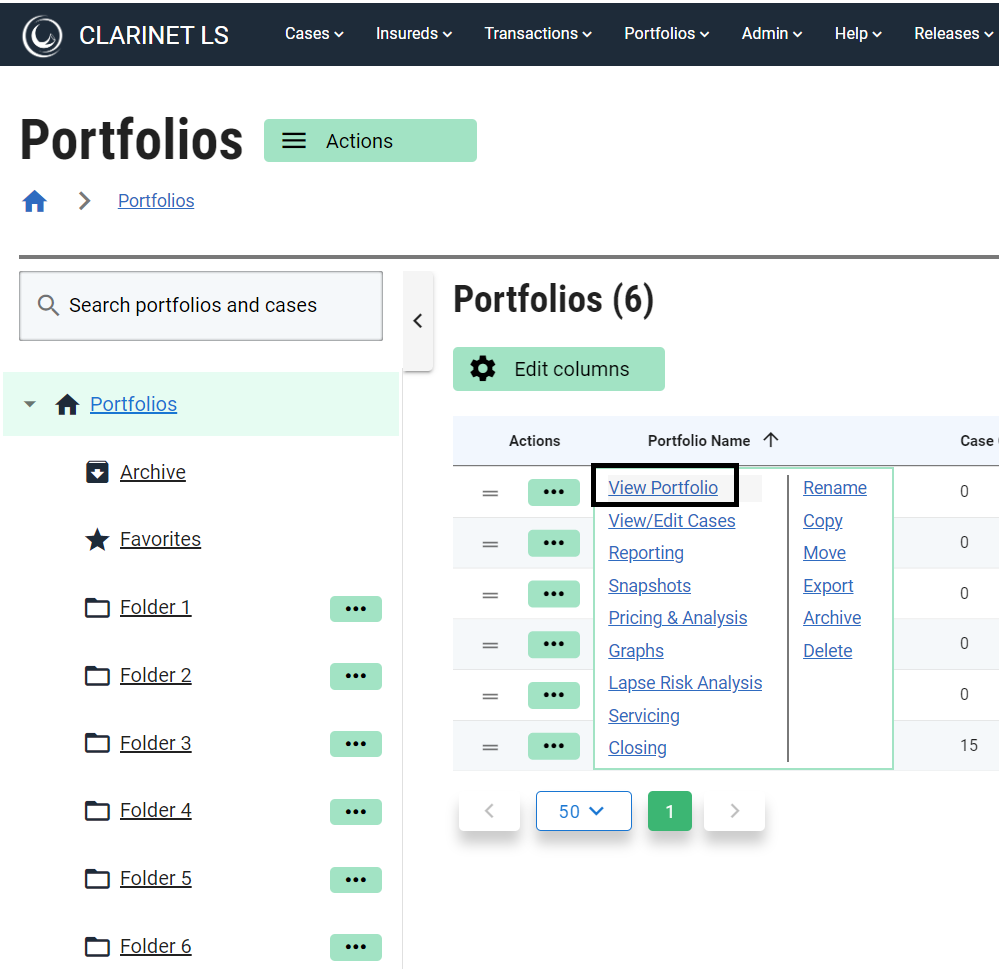
View Portfolio
Selecting a Portfolio from the Portfolio List page and clicking the View Portfolio link by hovering over the three dots action menu displays the details of the portfolio on several tabs.
Portfolio Summary
Portfolio level information is aggregated and calculated from the underlying cases within the Portfolio and results are displayed in the area shown below:
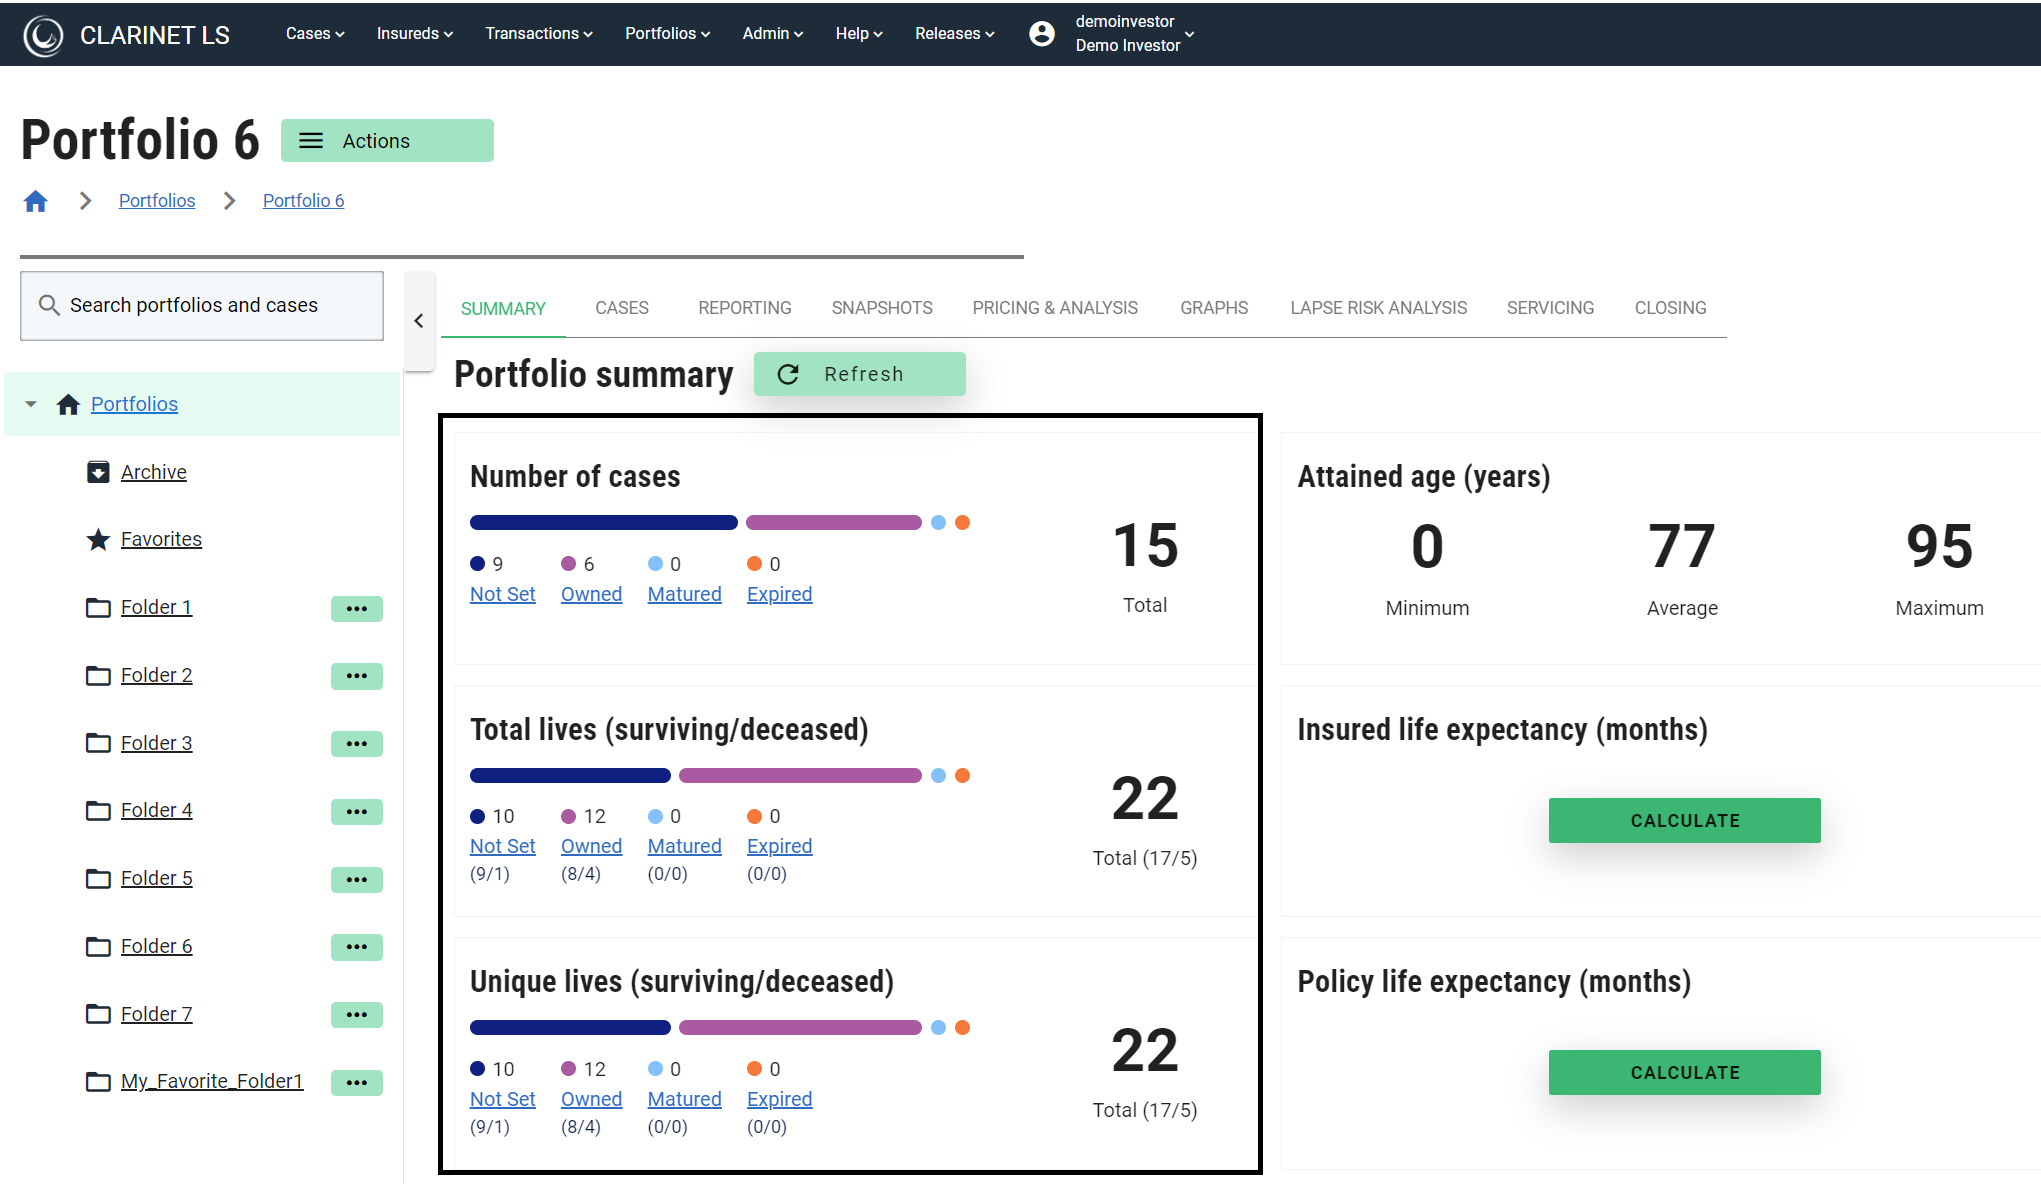
Total Lives Any insured counts as one, even if they are Linked in multiple Cases. In other words, Linked Insureds are counted multiple times. A single life policy counts as one, a joint life policy counts as two. Whether an Insured is Linked or not is irrelevant. The numbers in Total Lives do not represent individual persons, but rather insured “entities”. Therefore, the number of Deceased on the Total row should not be read as the number of deceased individuals, but as the number of insured “entities” marked as deceased in policies.
Unique Lives Insureds are counted only once. Linked Insureds are taken into account. Note that this calculation is done per Status. If a Linked Insured belongs to Cases with different Statuses, that Insured will be counted multiple times, once per Status. Therefore, the Total row is not the sum of each Status row. The Total row is correct on its own, and so is each row, but numbers from multiple rows cannot be added.
To explain calculation of the figures more fully, let's look at two scenarios where we have:
TestCase-1: Joe Bloggs and Jane Doe
TestCase-2: Joe Bloggs (same Linked Insured as in TestCase-1)
Scenario 1: Both insureds alive
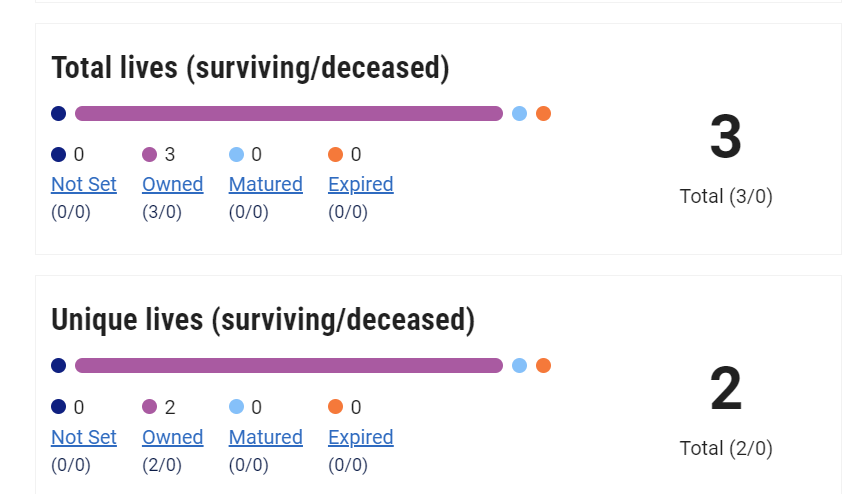
Status Both TestCase-1 and TestCase-2 have owned status.
Total Lives is 3, Joe Bloggs, Jane Doe and Joe Bloggs again, both surviving (3/0).
Unique Lives is 2, Joe Bloggs and Jane Doe, both surviving (2/0). Note, we are counting insured “entities” on policies, not individuals.
Scenario 2: Joe Bloggs is deceased (Date of Death entered on the Insured page)
Status TestCase-1 have a owned status and TestCase-2 have a maturity claim pending status.
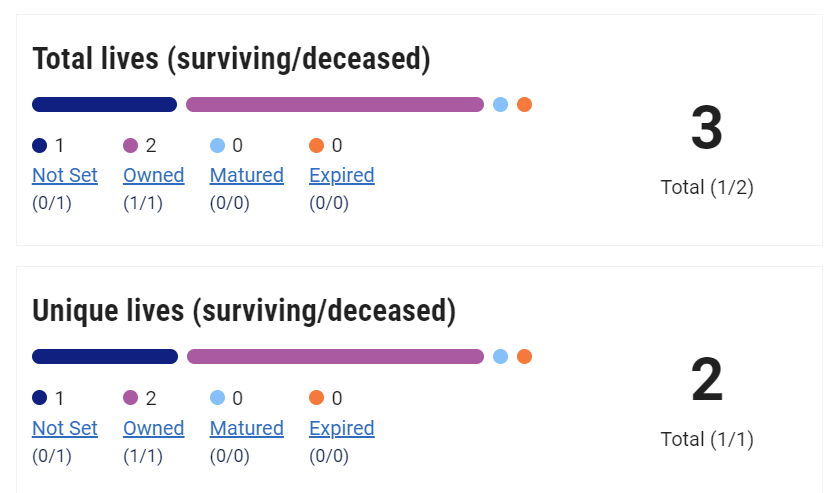
The Owned Status has 2 Total Lives, Joe Bloggs and Jane Doe, one surviving and one deceased (1/1)
The PEND Status has 1 Total Life (Joe Bloggs), zero surviving and one deceased (0/1)
Total Lives is 3, one surviving and two deceased (1/2). Note, this total of 2 deceased does not mean 2 individuals have died. It means two insured “entities” are marked as deceased in policies.
Unique Lives for the Owned Status is 2, Joe Bloggs and Jane Doe, one surviving and one deceased (1/1).
Unique Lives for the PEND is 1, Joe Bloggs, zero surviving and one deceased (0/1).
The Total is 2 Unique Lives, Joe Bloggs and Jane Doe, one surviving and one deceased (1/1). Note, this is not the sum of the rows as the count is done per Status at the Case level, and therefore one insured can be counted multiple times.
Each row is correct on its own, and the Total row is correct too.
Total Face Aggregates the Face Amount for each case belonging to the Portfolio. The same applies for Attained Age, Insured Life Expectancy and Policy Joint Life Expectancy.
Number of Policies Total number of policies.
Average Attained Age (years) A simple average of the current age of all surviving Insureds, after their last Birthday, rounded to the nearest integer.
Average Insured Life Expectancy (months) For each Case in the Portfolio, it will get the LE for each Insured. The LE used for each Insured in the Case is based on the Valuation Settings for that Case – for example, it could be setup to take the most recent report at 100%, or a blend of 2 reports weighed 50% each. If I have a joint Case, setup to take the most recent LE reports giving one Insured with an LE of 50, and one insured with an LE of 60, the average Insured Life Expectancy for the Case will be 55. The figures shown are rounded to the nearest integer.
Average Policy Joint Life Expectancy (months) If there are no Joint Cases in the portfolio, this should be the same figure as Insured Life Expectancy. It is an average of the “Used LE” figure for each Case shown on the Composition tab of the Portfolio page. For a Joint Insured Case, this figure is the result of blending the two mortality curves in use for each Insured (which is determined by the Valuation settings).
Example
On an example Joint case below, for the Primary Insured it is blending 50% two LE reports (59 and 74) to give an LE of 66.5. For the Secondary Insured, it is 100% of one report, giving an LE of 80.
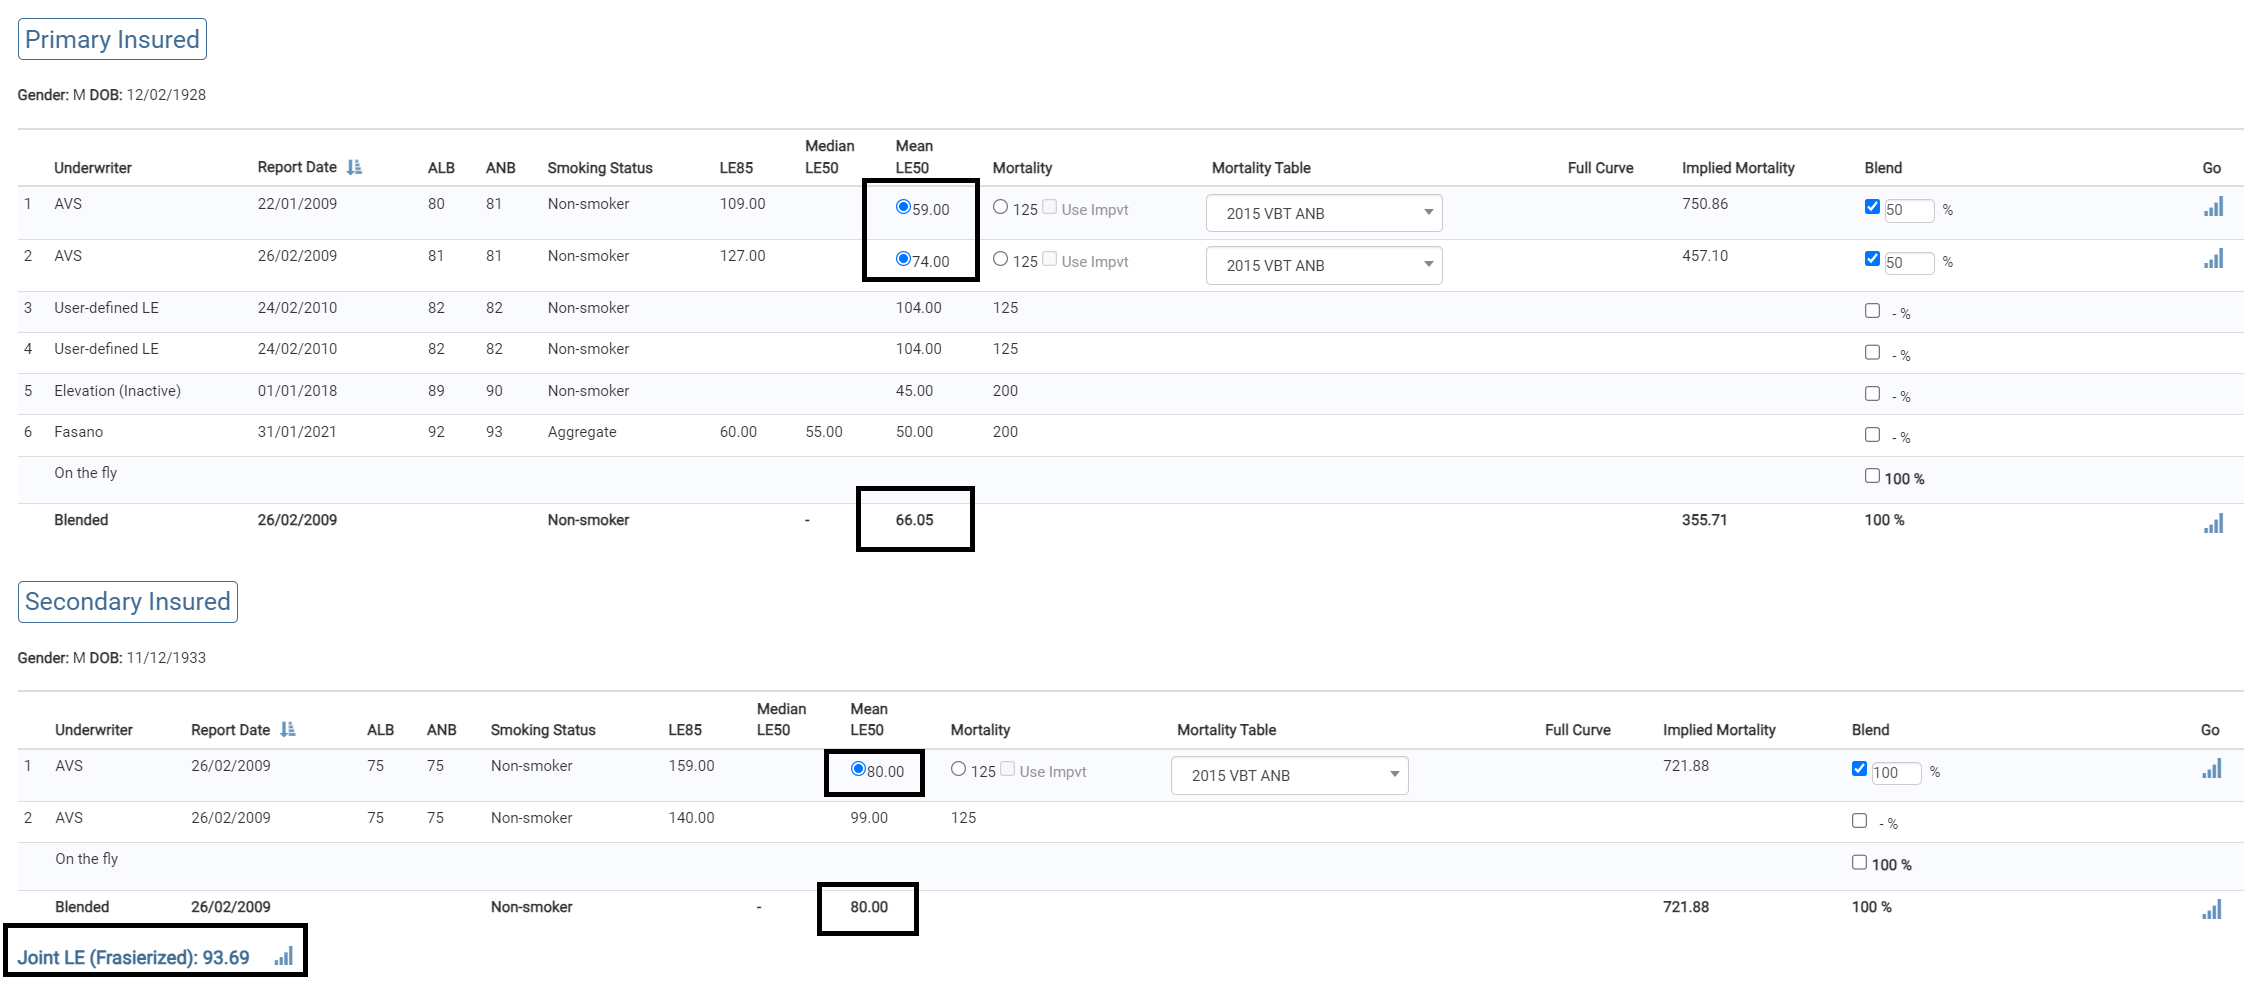
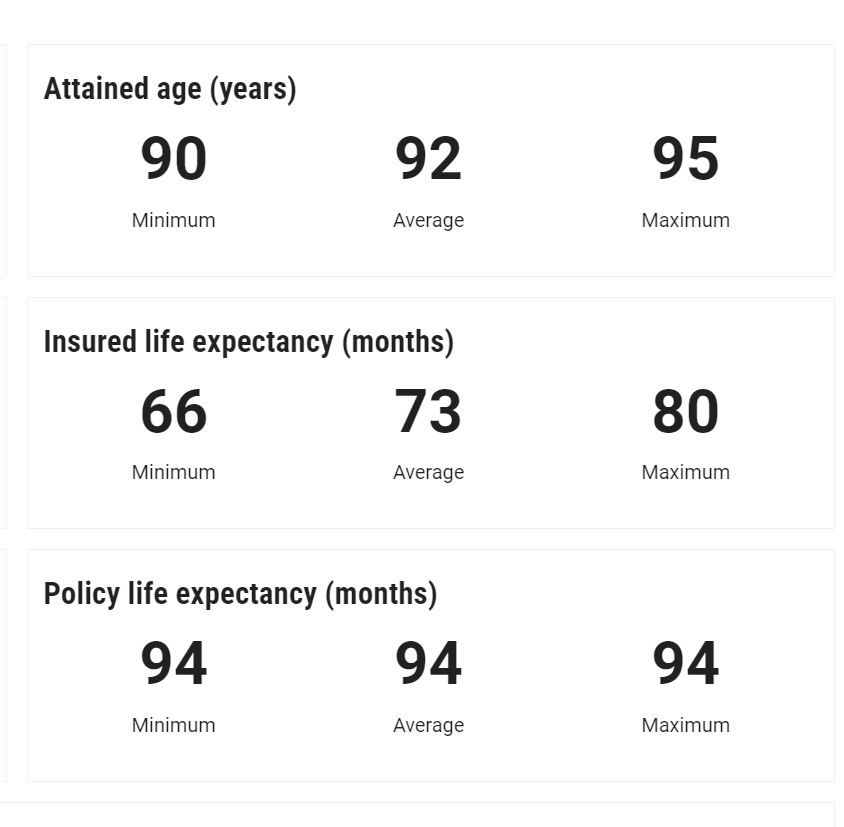
The Attained age (years) for the Case will be (95+90) / 2 = 92.5, rounded to 92.
(Age of Insured1+Age of Insured2)/2
The Insured Life Expectancy for the Case will be taken as (66.5+ 80.00) / 2 = 73.25, rounded 73.
The Policy Joint Life Expectancy will be the combination of the two Insured’s mortality curves, which as shown below is 93.69 rounded off to 94.
In case of any errors in cases within a portfolio and calculations cannot be performed, partial valuation results will be generated with the valid cases and the case with errors will be listed in Errors tab as shown below.
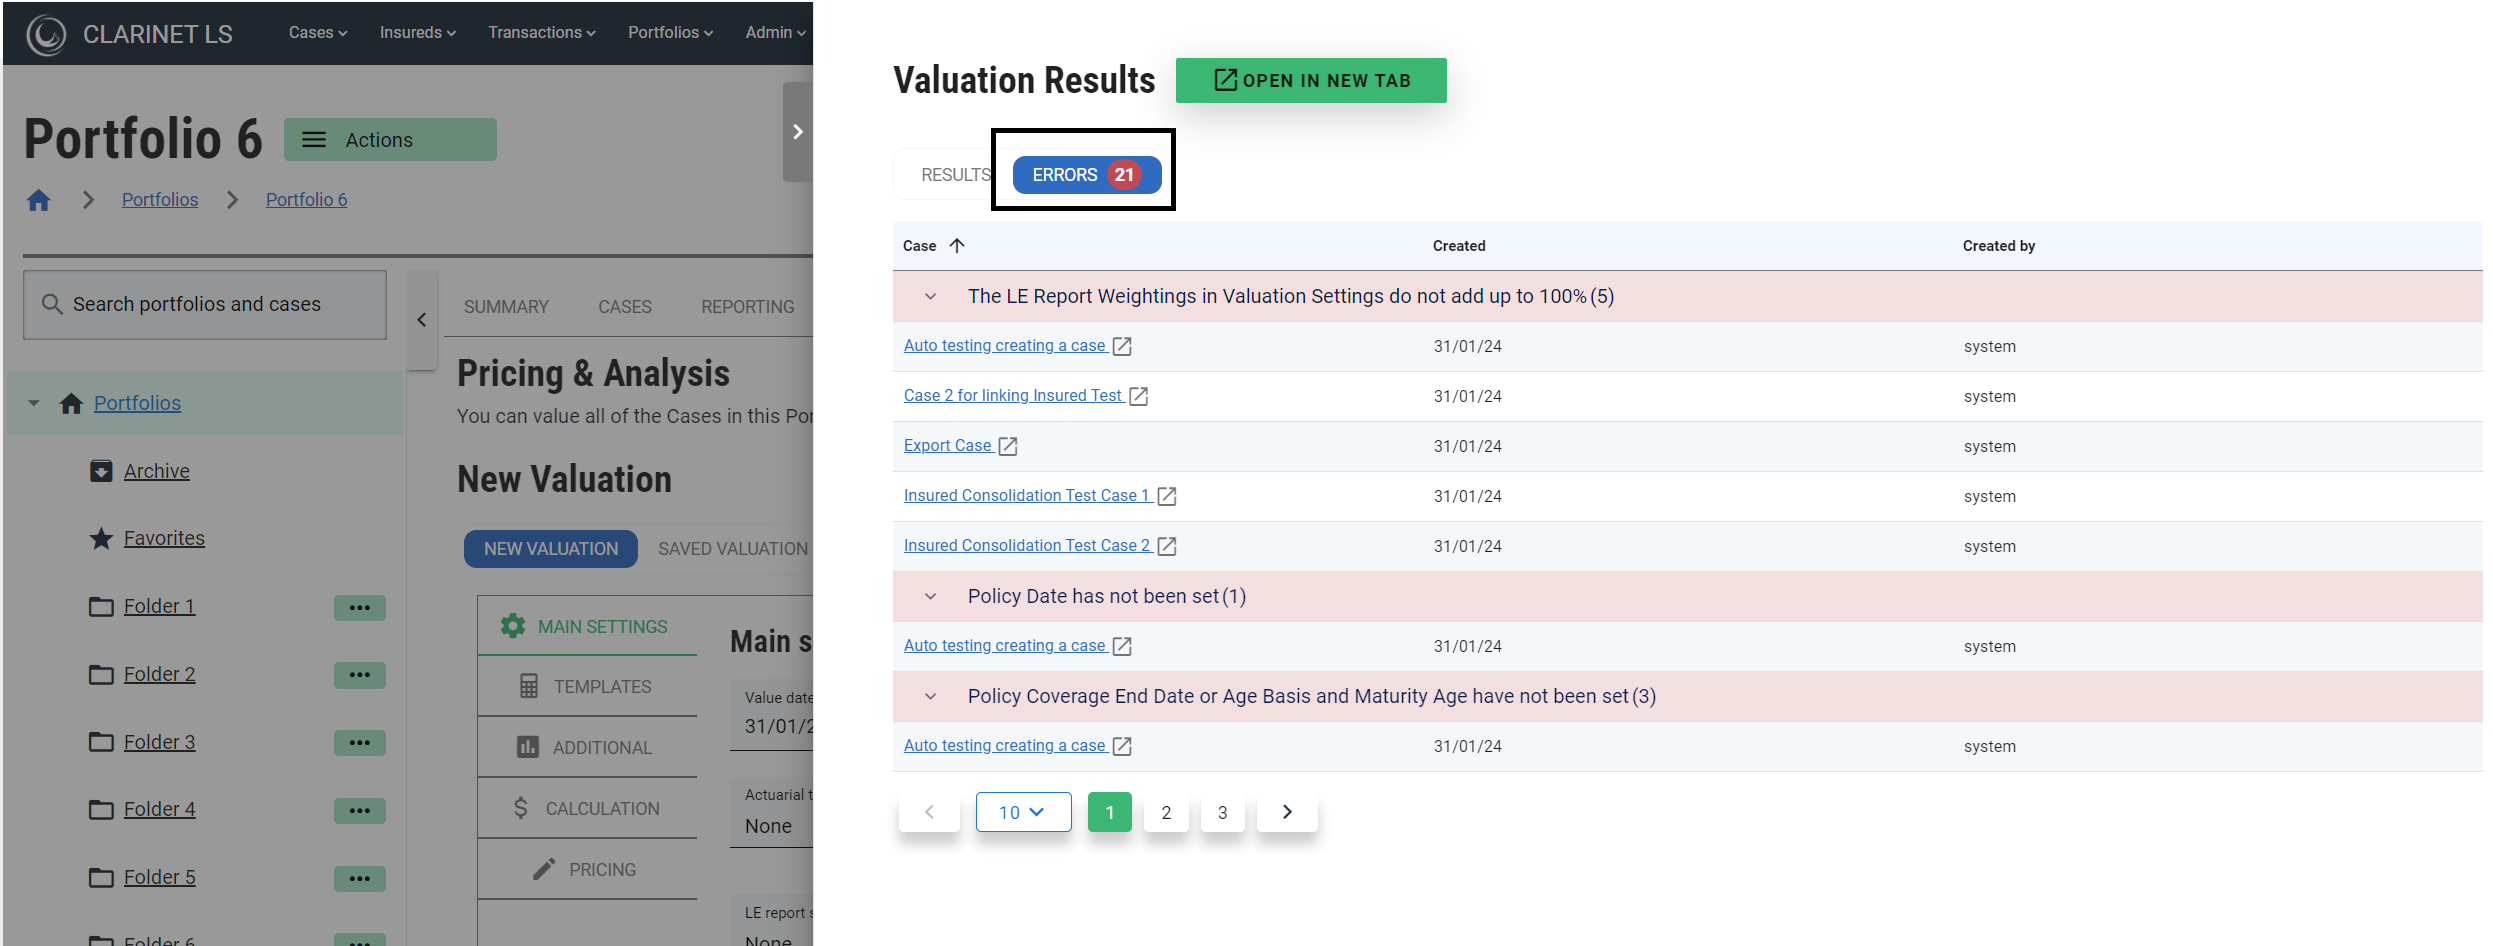
Example showing Portfolio Tabs
View/Edit Cases
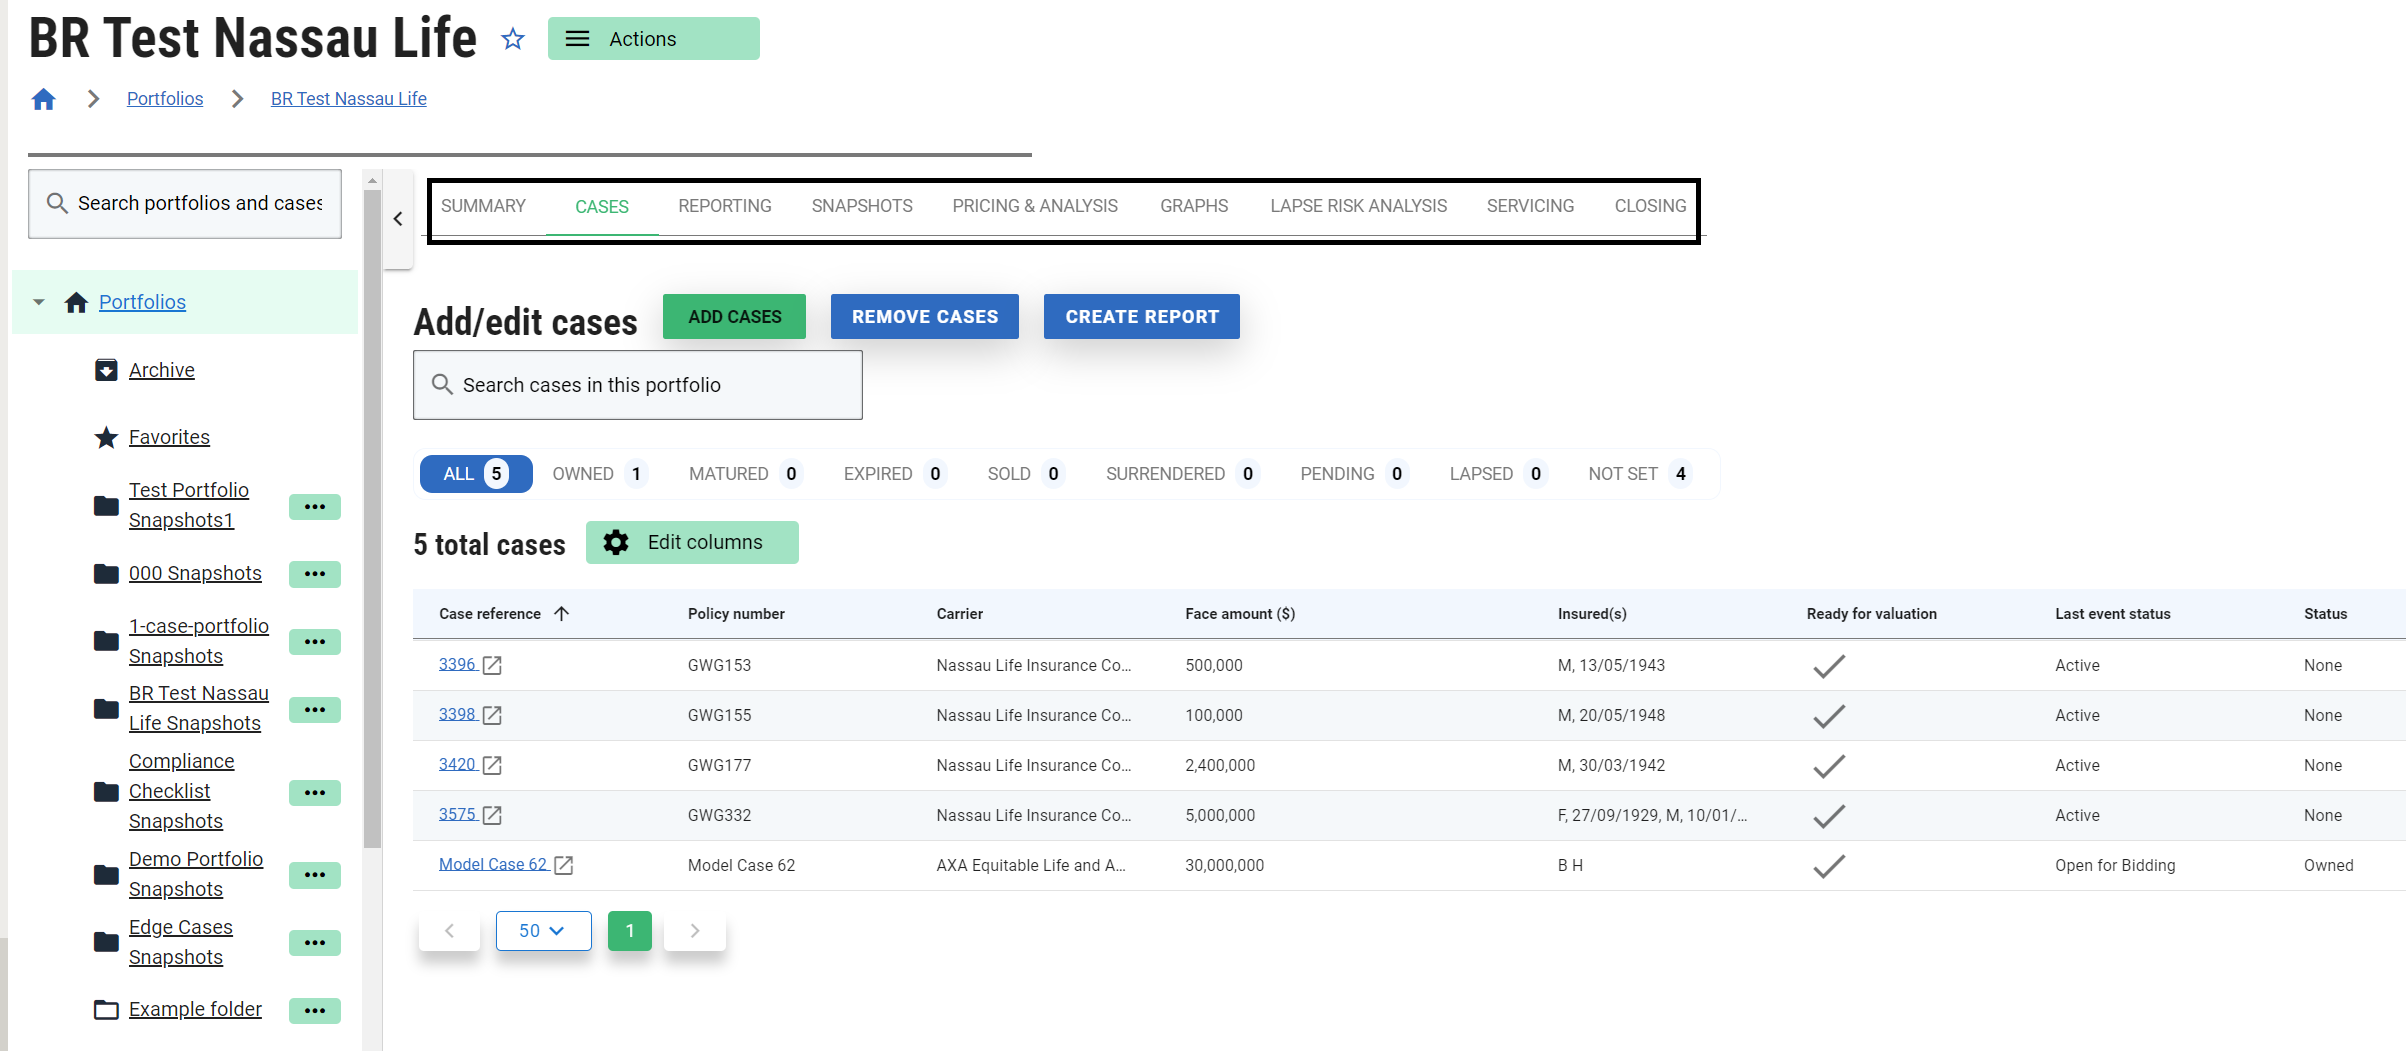
Select a portfolio and click on View/Edit Cases to view the Cases tab. This tab lists the cases belonging to a Portfolio.
In order to change the portfolio composition, click on the Add Cases or Remove cases button.
Cases are further filtered based on their last status. In the above example, there are 5 cases in total in the selected portfolio (Owned: 1 and Not Set: 4).
All the cases listed under case reference columns are hyperlinks, which allows you to navigate away to view particular case information.
The Ready For Valuation column indicates whether a case is ready for valuation. If a cross is shown the case will be excluded from any valuation for the reasons shown when hovering over the cross.
Reporting
Select a portfolio and click on Reporting to view custom reports, built-in reports, and export templates.
All the reports are listed under the reports tab which can be favorited by clicking on the empty star icon. And the favorited reports will be listed under the favorites tab.
Each row for a particular report denotes the number of columns available in a report.
You can further filter reports displayed by clicking on the recent tab which will list all the recently run reports.
Snapshots
Select a portfolio and click on Snapshots to view past snapshots or create new snapshots.
Snapshot this Portfolio: Clicking the create snapshot button takes a snapshot of the Portfolio data and lists it in a new folder given the Portfolio name and suffixed with Snapshot and the date and time the snapshot was taken.
Pricing & Analysis
Select a portfolio and click on Pricing & Analysis to create/view valuation and perform other pricing-related calculations listed below.
New Valuation generates the Valuation results for the selected Portfolio.
Saved Valuations displays a list of all historic valuations for the selected Portfolio.
Monte Carlo opens the Monte Carlo Simulation page for the selected Portfolio.
Actual Expected opens the Actual Vs Expected page for the selected Portfolio.
Portfolio Generator opens the Portfolio Generator page for the selected Portfolio.
Risk Analysis opens the Portfolio Risk Reporting page for the selected Portfolio.
Pricing settings allow you to pre-select/default the valuation parameters like the Valuation template for future valuations to be generated.
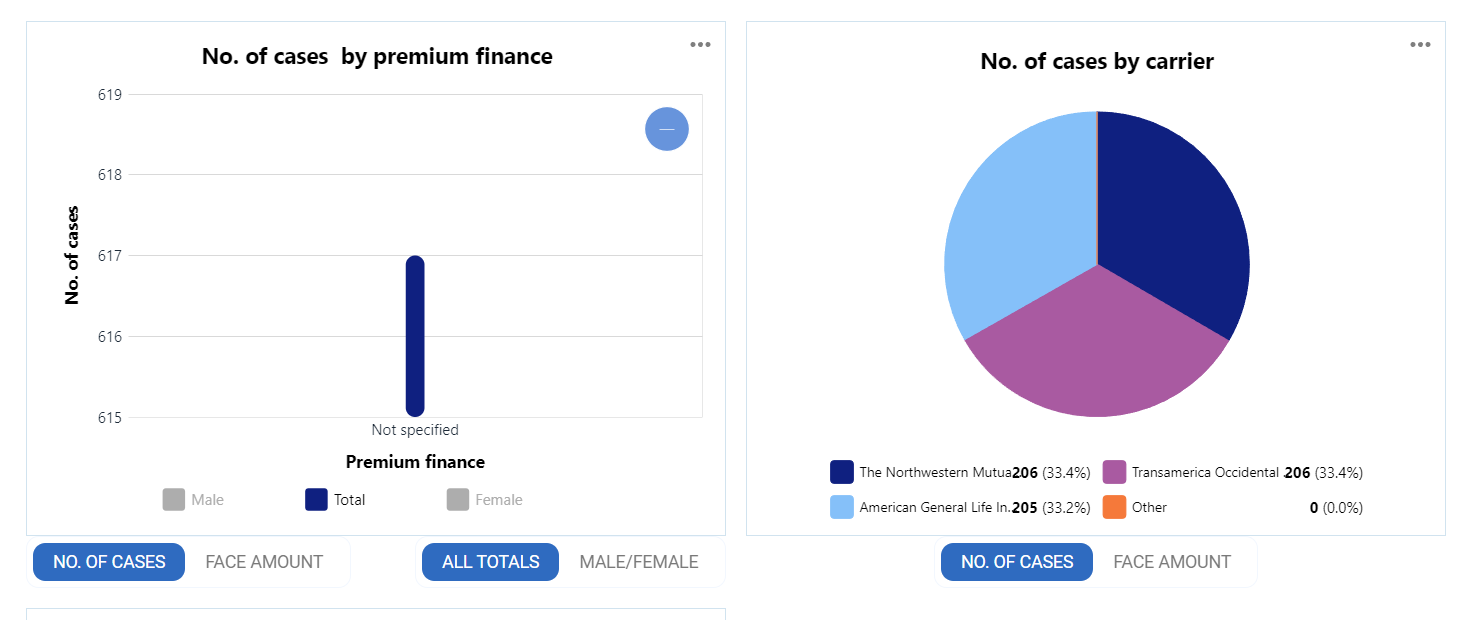
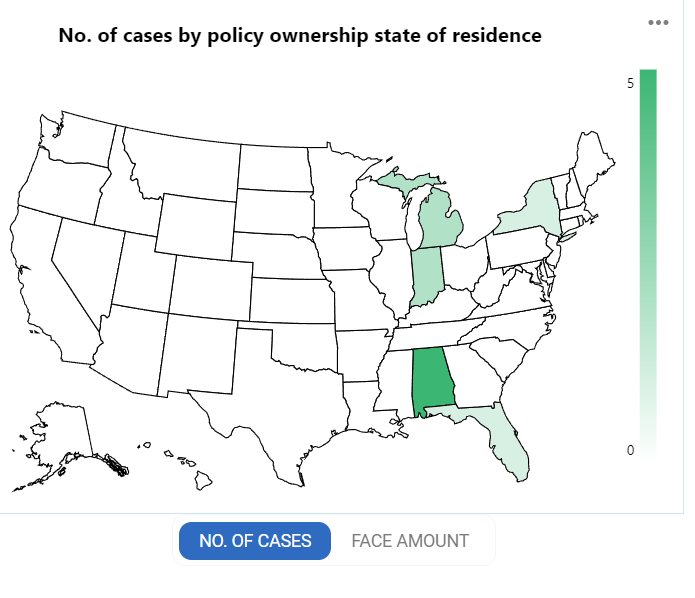
Graphs
Policy
Displays summary graphical information about the policies for all Cases in the selected Portfolio.
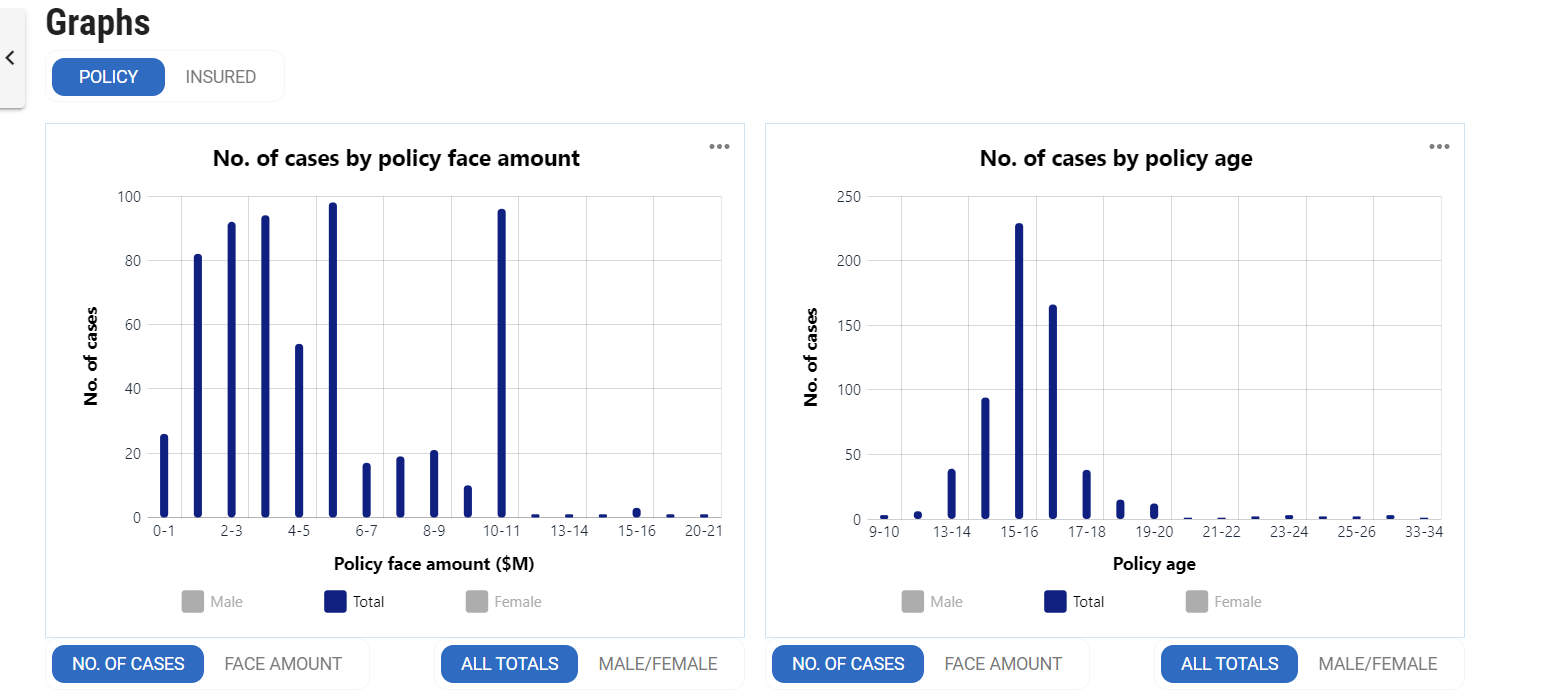
Charts “by Policy Year” or “by Policy Age” are all based on the “Policy Date” field of the Policy.
Insured
Displays summary insured information in graphical form for all Cases in the selected Portfolio. The graphs always show the latest LE.
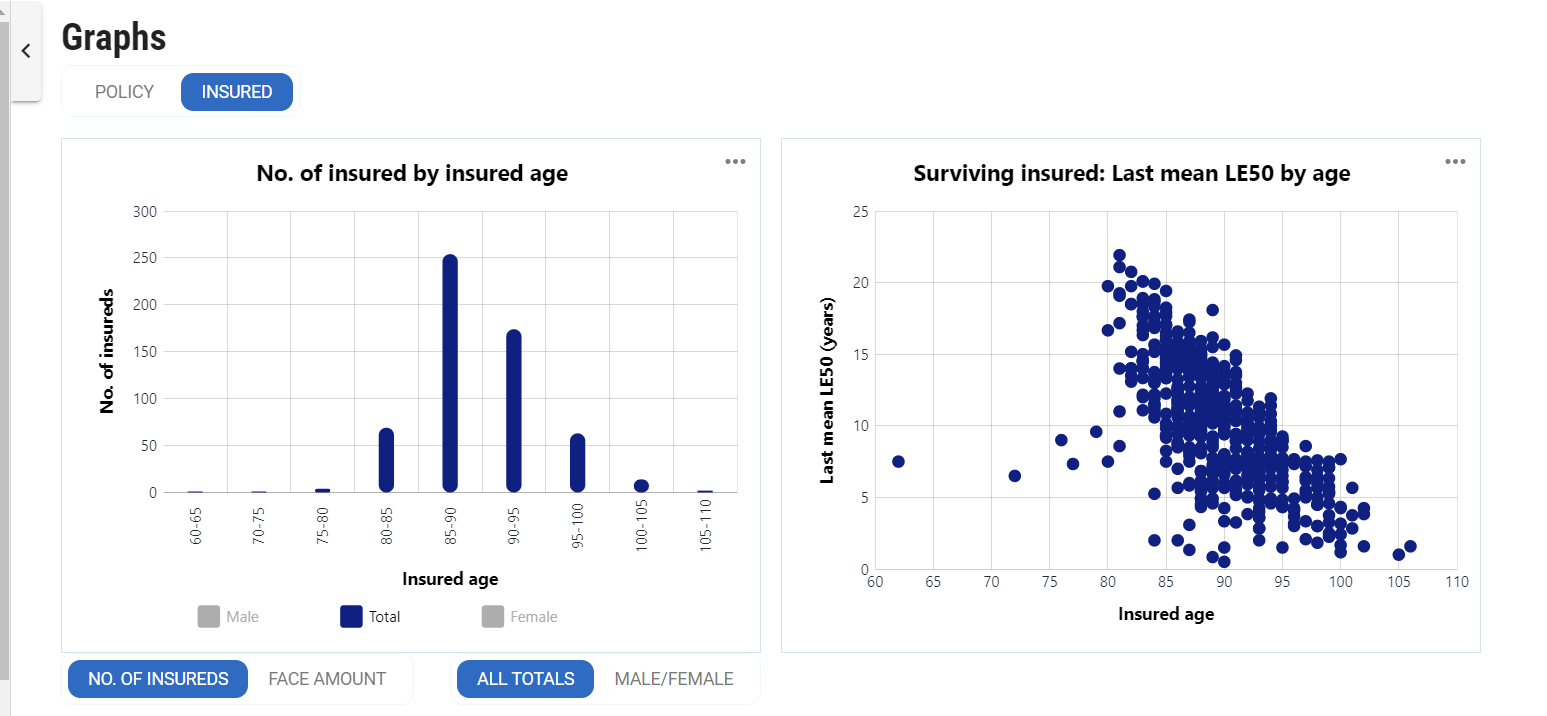
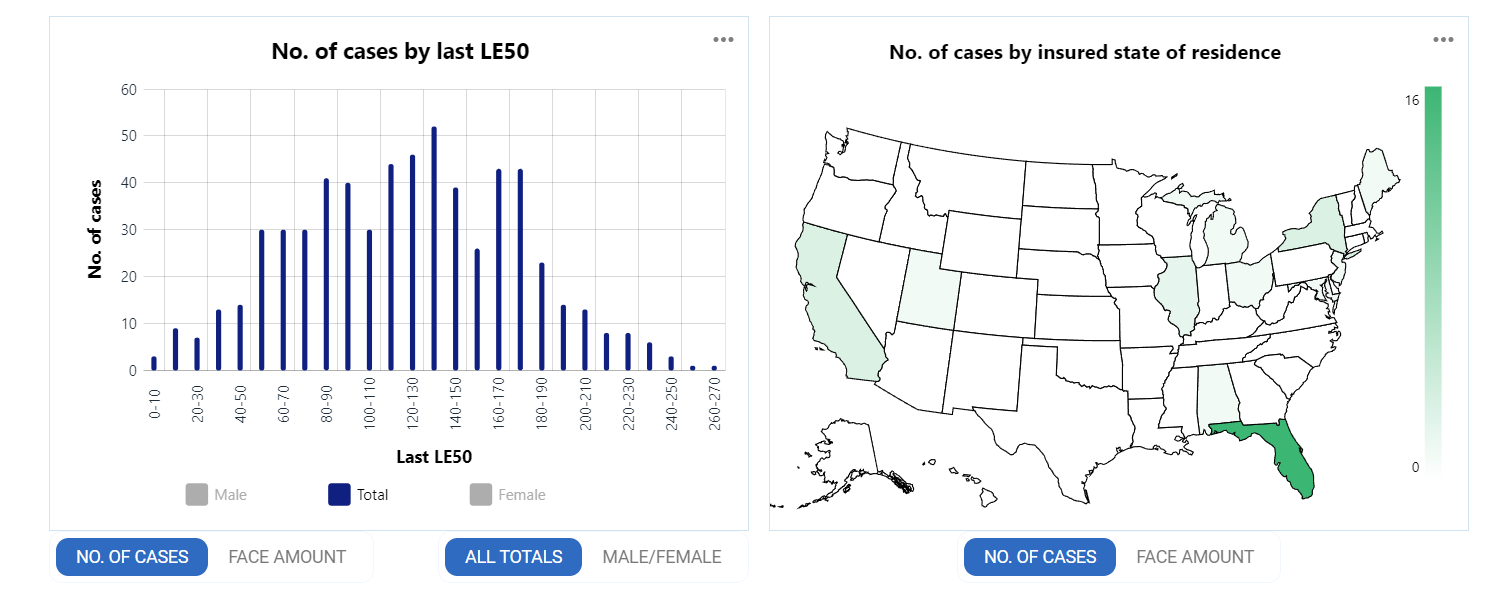
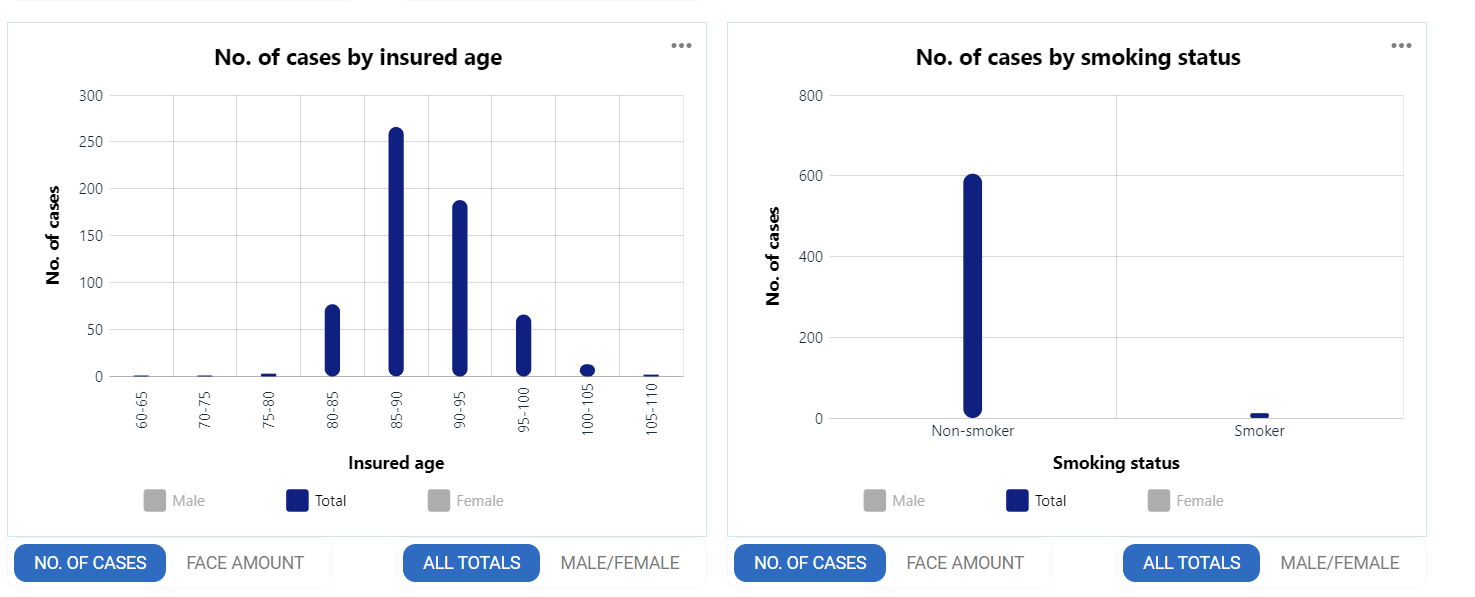
For Joint Life Cases, the Insured graph shows each Insured’s last LE separately.
Lapse Risk Analysis
Displays lapse risk information in tabular form for all cases within the selected Portfolio.
Servicing and Closing
Servicing Settings opens the Portfolio Servicing Settings page for the selected Portfolio.
Servicing Tasks opens the Servicing Tasks page for the selected Portfolio.
Order Tracking displays outstanding orders(neither canceled nor completed) and those with outstanding follow-up comments. View Closing Checklists for all Cases in the Portfolio opens the Closing Checklists for Portfolio page for the selected Portfolio.