Monte Carlo Distribution Analysis
Overview
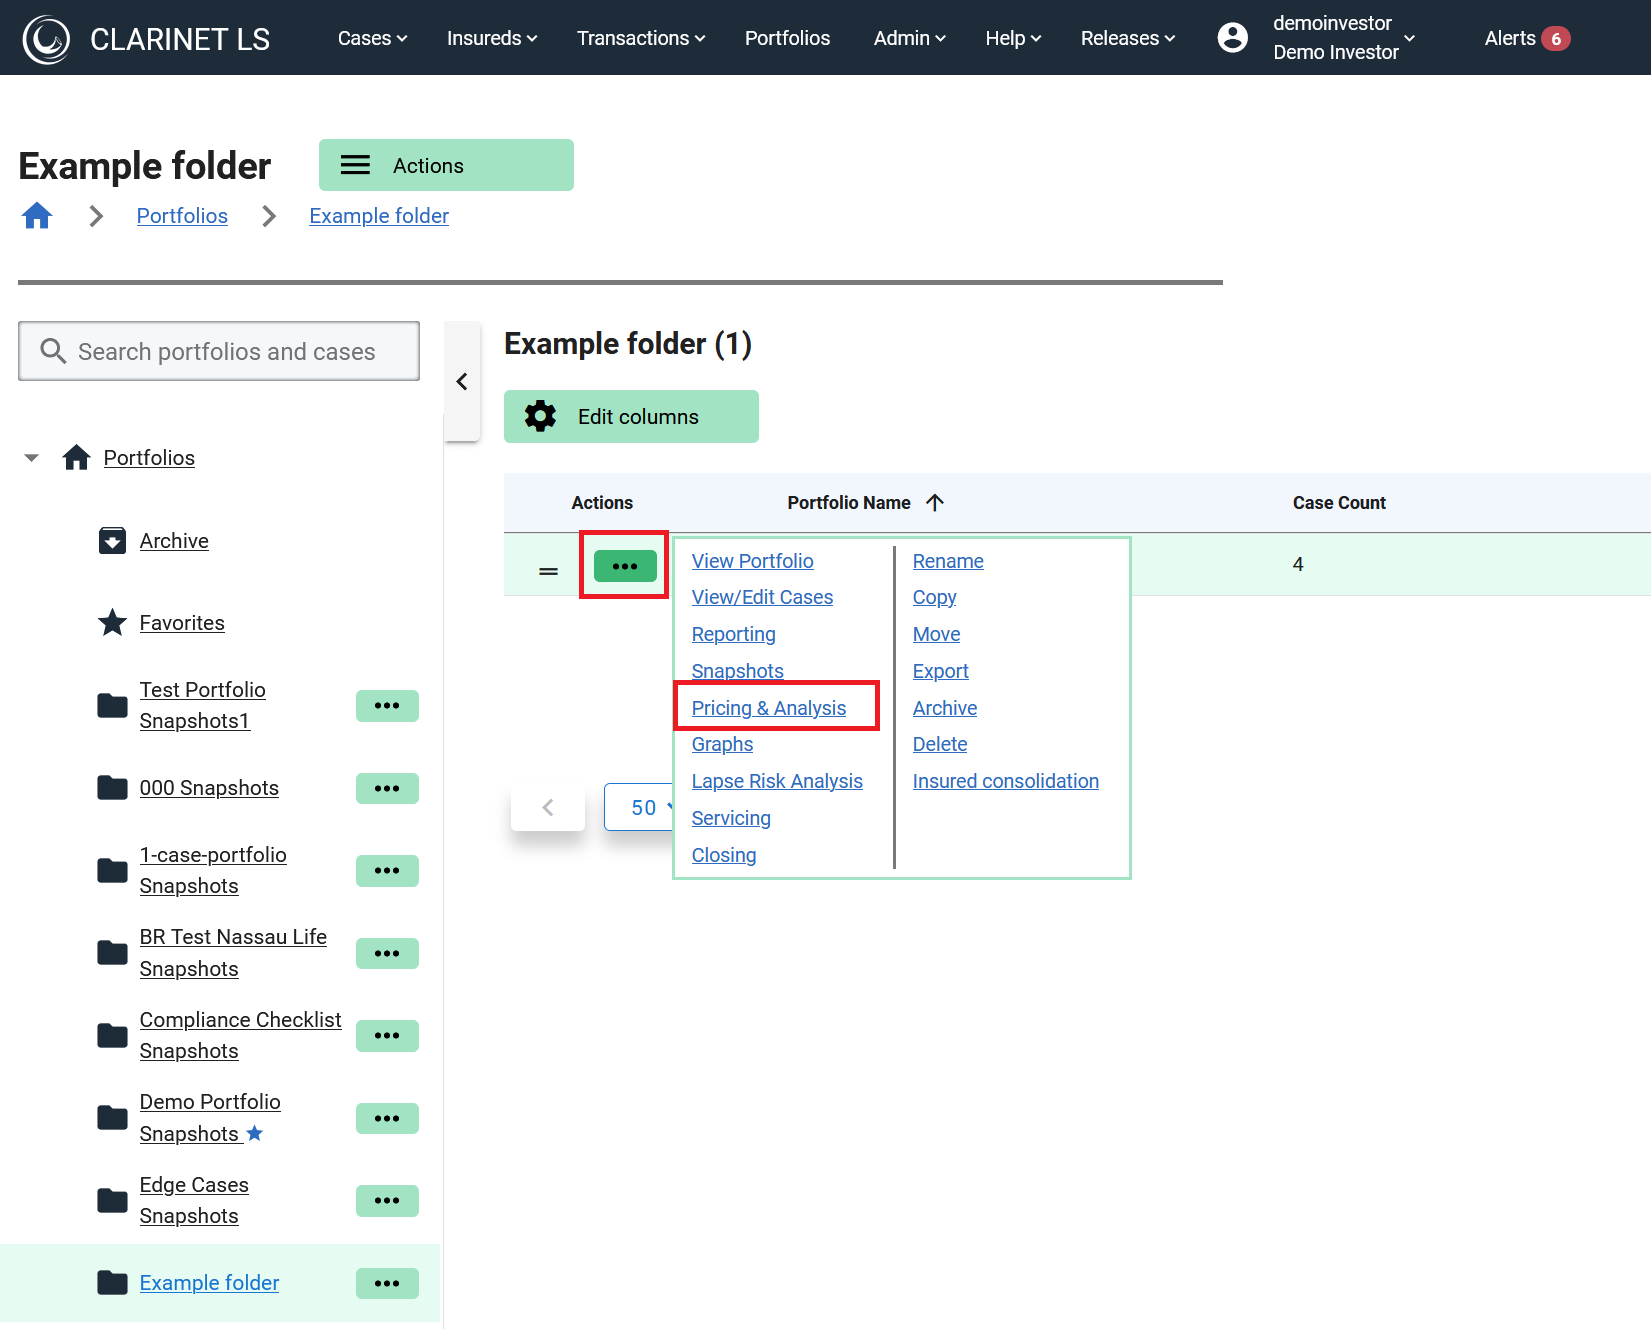
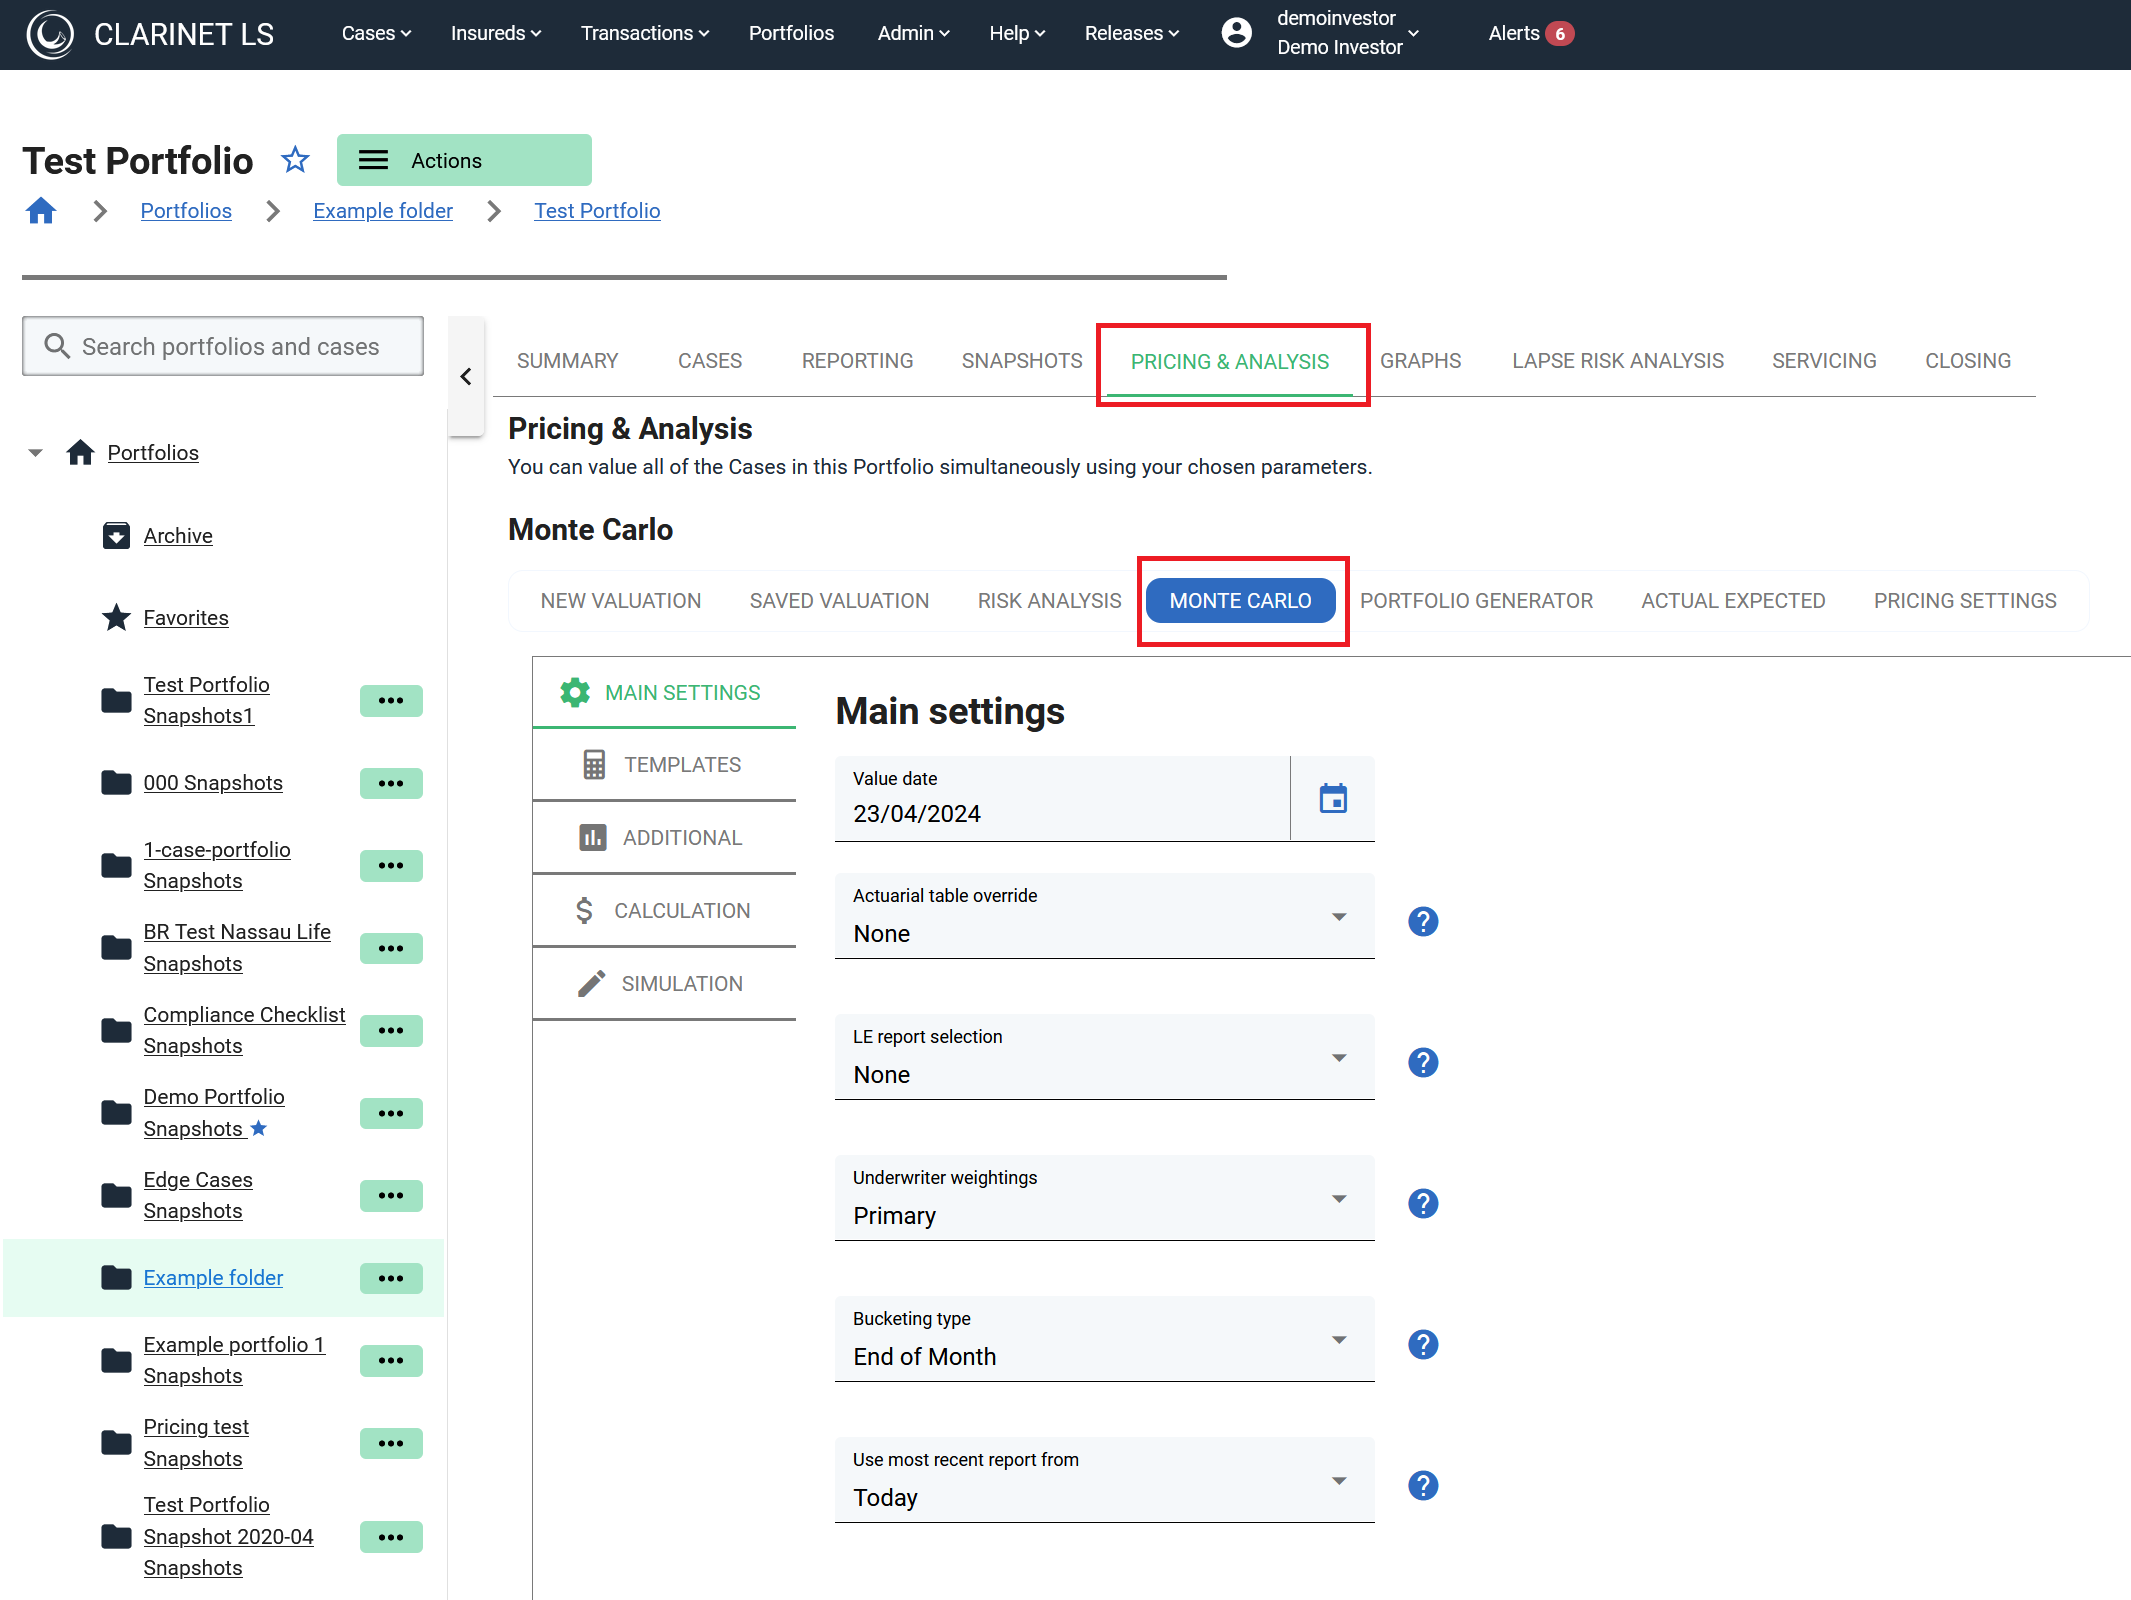
The portfolio Monte Carlo functionality in ClariNet includes an Excel sheet that shows detailed cash flow distributions. From the Portfolio page, the Monte Carlo page is accessed here:
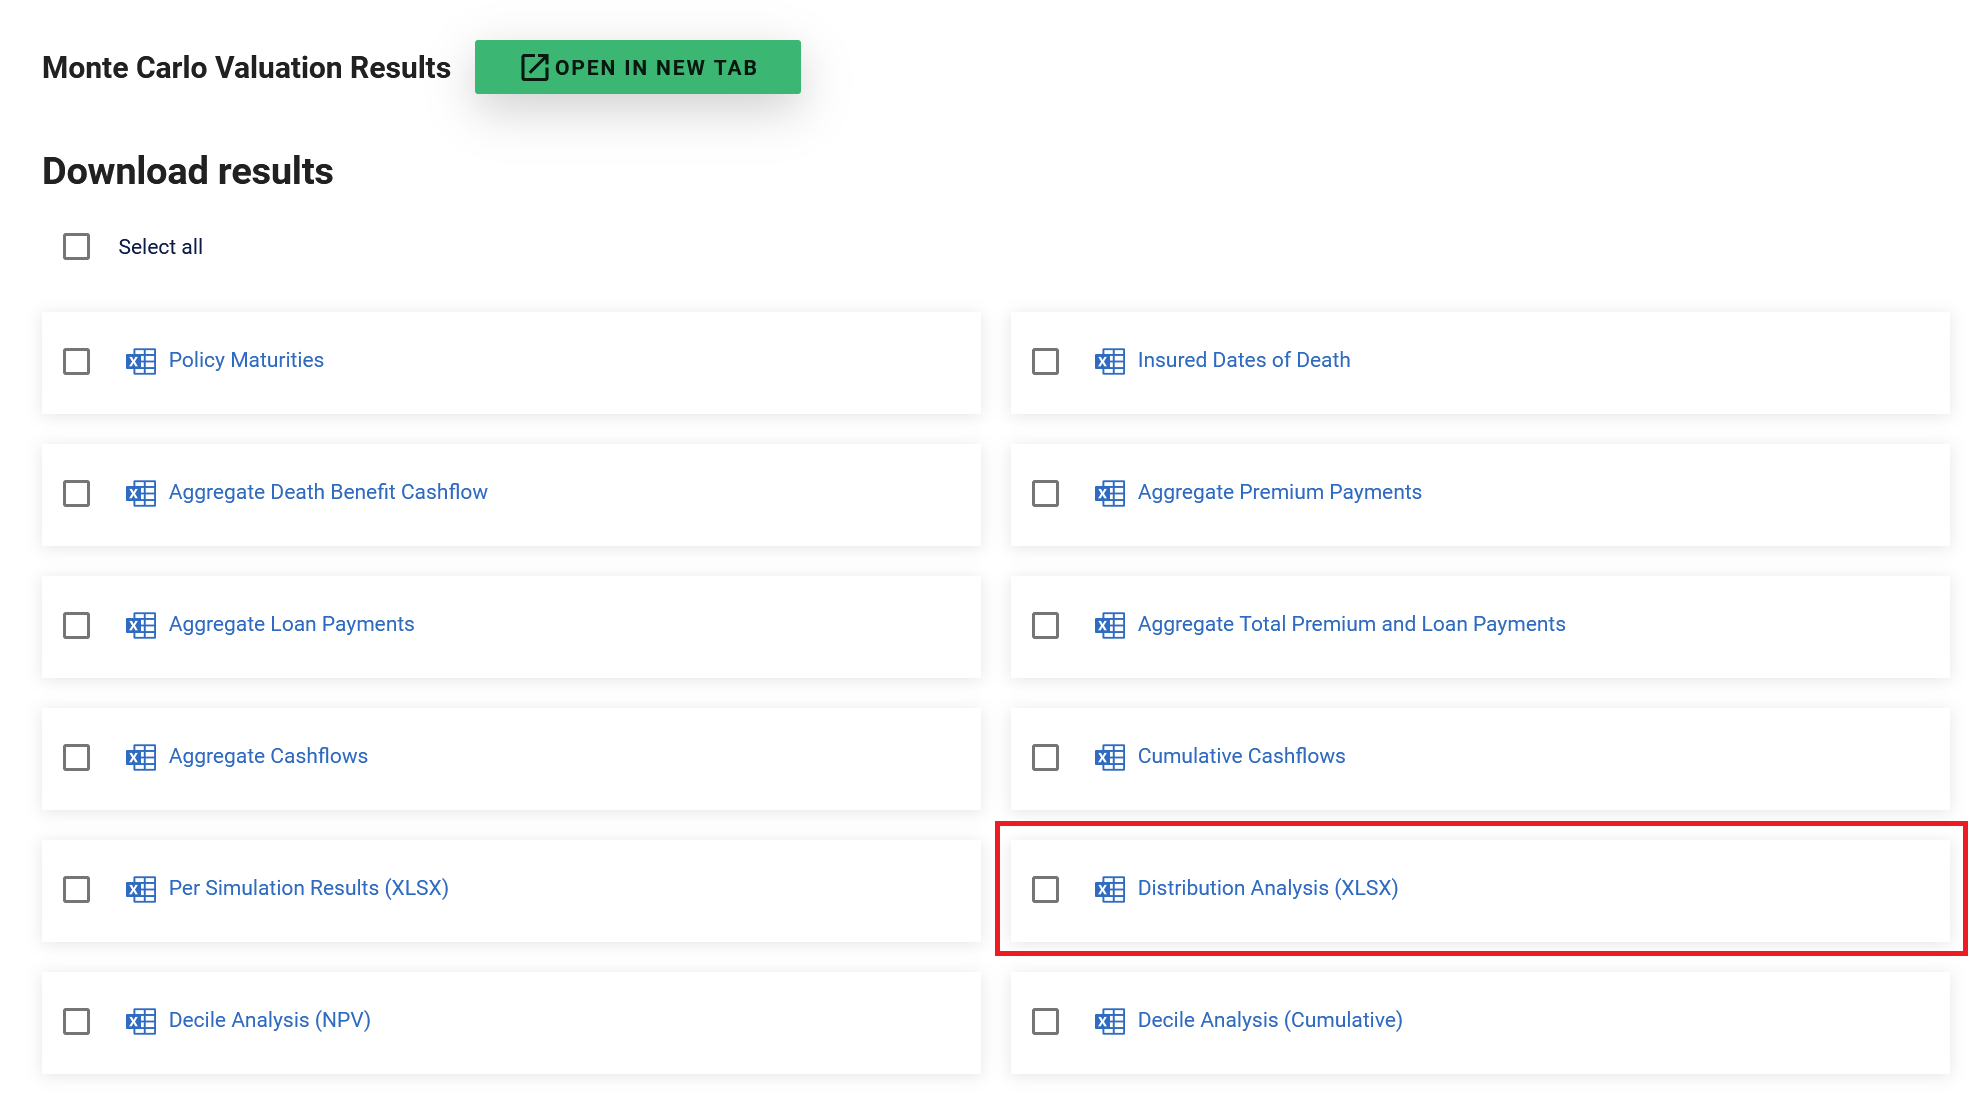
And once you have generated the results, the Distribution Analysis is here:
Details
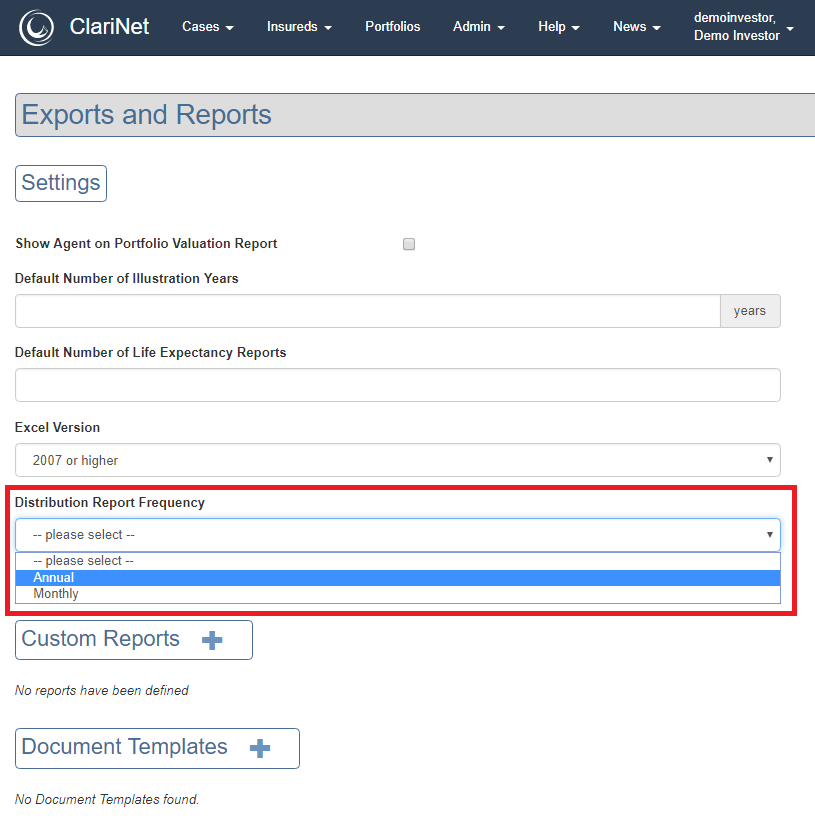
For the purposes of this description, we are referring to annual analysis (the Distribution Analysis can be calculated on an Annual or Monthly basis depending on this setting from Admin->Exports & Reports):
Cashflows Worksheet
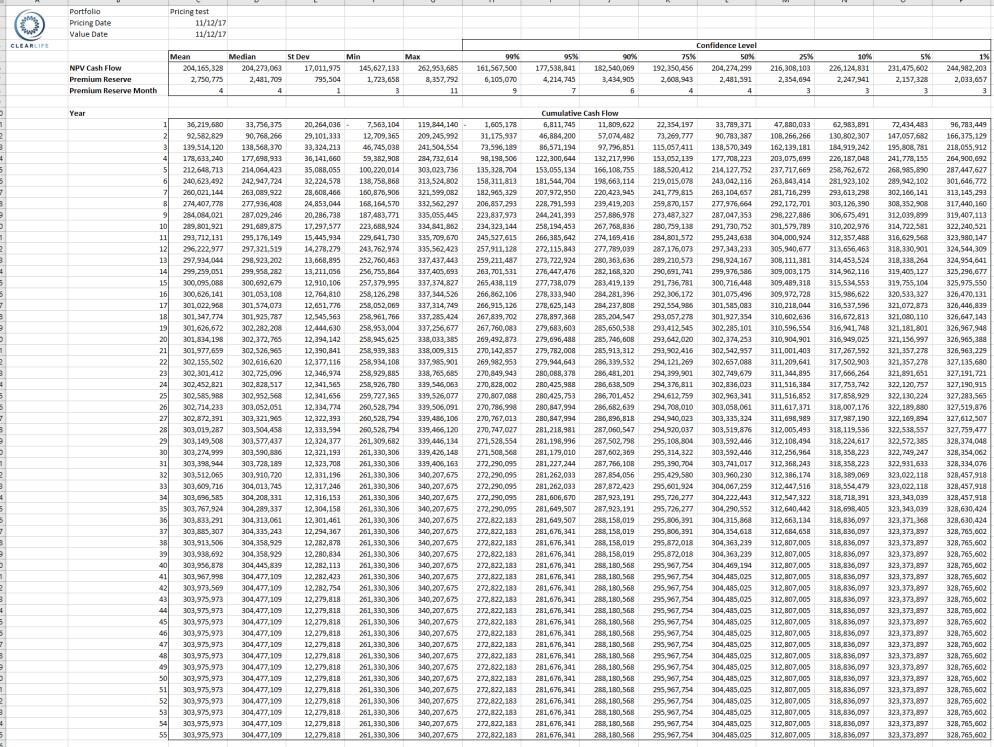
The data shown below the text Cumulative Cash Flow (cells C11 onwards) shows the total cash flows received from the portfolio at each point in time from Value Date, summarized as a Mean, Median, Standard Deviation, Min and Max.
To give an example, if you ran 1,000 simulations, the value in cell C11 shows the mean net cash flows from the portfolio across those runs in year 1. This figure can be reconciled by looking at the AggregateCashflows sheet (also on the MC page) and summing and averaging the first year of cash flows for all 1,000 runs.
Columns H – P shows the confidence values from the distribution – these are obtained by simply ordering the results of the individual simulation runs and taking the relevant percentile. For example, the 1% confidence interval gives the portfolio cash flows dollar amount which is only exceeded in 1% of simulation runs. The 99% confidence figure tells you that in 999 simulation runs, the cash flows are greater than that figure.
The figures shown in the header section (cells C6:P8) show the portfolio NPV with the same distribution analysis, along with a calculation of how much cash needs to be reserved to cover premium payments. The premium reserve calculation is evaluated on a monthly basis for each individual simulation. The month at which the lowest point occurs is shown.
Premium Reserve
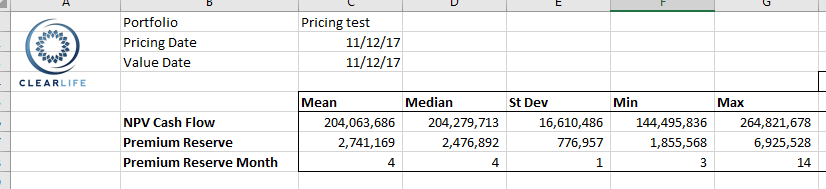
In this example, the calculation is saying that in the worst-case scenario, we need to have $6,925,528 available to cover premiums. It is also saying that the maximum drawdown occurs in month 14.
Other Worksheets
- Death Benefit and Premium worksheets simply show the cash flows specifically associated with those streams;
- Policy Count worksheet indicates how many policies are still in force in each scenario;
- Cashflow Analysis gives a mean and upper and lower confidence interval analysis of portfolio cash flows over time.
Bucketing
Please note that if End Of Month bucketing is used, the first period results (both the first month and the first year) will be different to the following periods since a proportion of cash flows will flow into the 2nd month. To avoid this use either None or Raw Cashflows.