COI Calculation
This document explains two aspects of COI in ClariNet LS:
- How ClariNet LS uses the annual COI rate to calculate a COI payment;
- Extrapolation of the COI curve calculated from illustration data.
COI Payment Calculation from Periodic COI Values
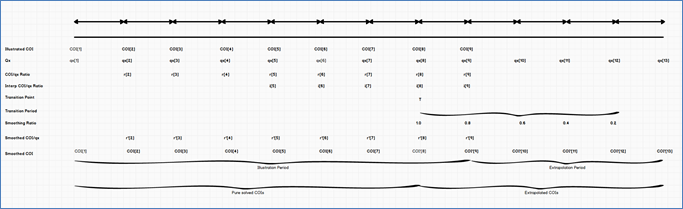
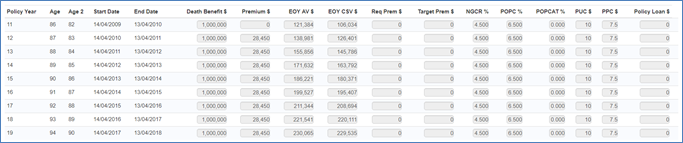
This is the COI curve for a short illustration in ClariNet LS:
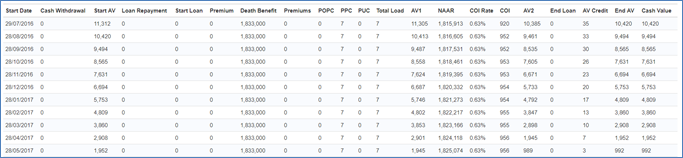
And the associated calculation for a single policy year:
There are several data points here, which are related as follows:
Illustrated COI (COI table): the annual COI rate calculated by an iterative solver from the input illustration
Used COI (COI table): the annual COI rate that will be used in the minimum premium calculation (see later in this document for a description of how this relates to the Illustrated COI).
COI Rate (COI Calculation tab): the annual COI rate.
Monthly COI: this figure is not shown but is calculated internally.
COI (COI Calculation tab): the dollar COI charge.
Other input values in the COI calculation are:
Death Benefit: taken from the illustration.
Discount Rate applied to NDB in NAAR calculation (take from the Premium Calculator Template). This parameter can have the value Guaranteed Rate, None or Non-Guaranteed Rate;
AV1: this value represents the reference Account Value for the NAAR calculation. It's taken from the Start AV plus premium payment minus loads.
Guaranteed Crediting Rate: taken from the illustration.
Non-Guaranteed Crediting Rate: taken from the illustration.
NAAR: net amount at risk.
The calculation is:
Reference Rate = Discount Rate applied to NDB in NAAR calculation
COI Rate = Used COI / 1000
Monthly COI = 1 – (1 – COI Rate) ^ (1 / 12)
NAAR = Death Benefit / ((1 + Reference Rate) ^ (1 / 12)) – AV1
COI = Monthly COI / (1 – Monthly COI) X NAAR
Extrapolation
COI curve extrapolation may be necessary for 2 reasons:
- A negative COI is calculated in the first period, often due to an unknown or incorrect starting account value;
- The data entered in the illustration does not extend to the Maturity Age of the policy.
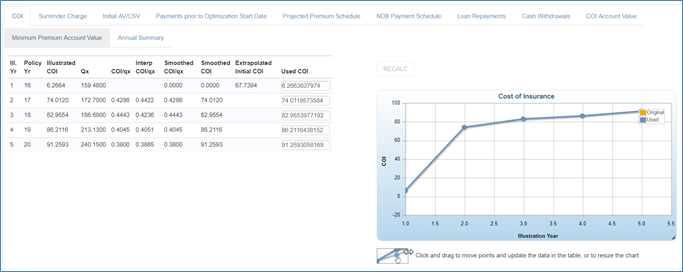
In both cases, ClariNet LS can extrapolate the COI curve. This is an example:
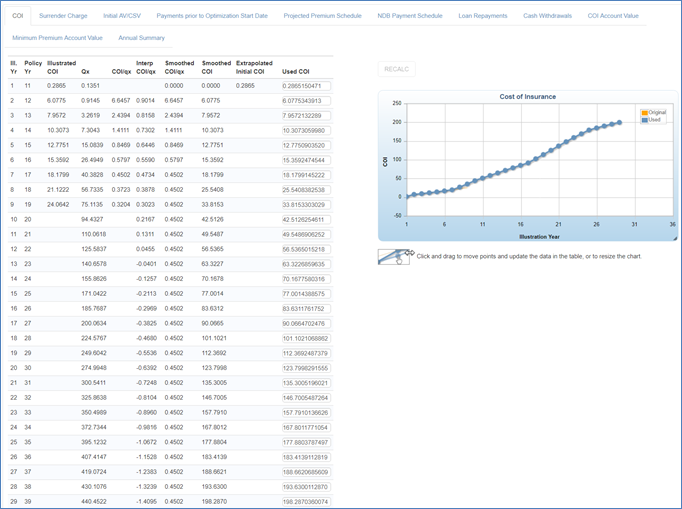
The source illustration is:
The policy has a maturity age of 110, so the COI calculator needs to extrapolate for 20 years. In addition, a negative COI has been detected in the first period, so the COI curve is extended backwards, and an initial account value is calculated. The screenshot above shows the status after the first period COI has been calculated and a new Initial Account Value has been found.
First Period COI
If the solved first period COI is negative, the calculator will compute a suitable first period COI, using one of two methods.
Premium Calculator Parameter Use ratio of COI/qx in calculating first period COI = TRUE
The calculator will compute the ratio of the sum of COI values over the qx values in the following 3 periods:
This value appears as 0.2865 in the COI table above as the Extrapolated Initial COI.
Premium Calculator Parameter Use ratio of COI/qx in calculating first period COI = FALSE
The calculator will compute a linear regression of the COI value in periods 2 to 4. The slop and intercept are then used to estimate the period 1 value. The chart looks like this:
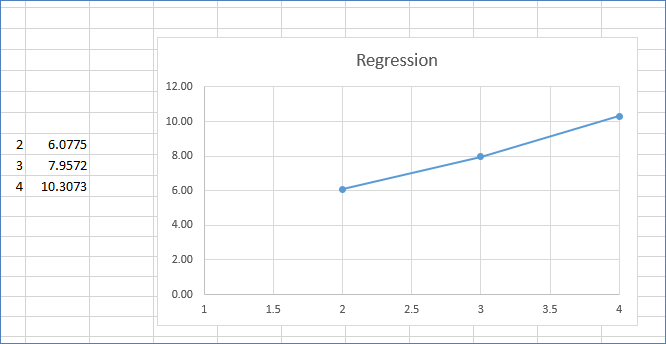
Slope = 0.0021148858033678878
Intercept = 0.0017693604626020654
This would lead to a value of 3.8842 in table for Extrapolated Initial COI.
Extrapolation of COI to Maturity
This process happens in 7 stages:
- Calculate the ratio of COI/qx in each period (shown as COI/qx in the COI table);
- Calculate a linear regression of the last 5 periods of COI/qx ratios from the solved illustration data. If there are less than 5 period of data, use as many as possible;
- Calculate a "transition point". This is the period when we switch from actual solved COI to estimated COI. This will occur in the penultimate period of the illustrated COI curve (illustration year 8 in our example);
- Calculate a "transition period". This is the period where we smooth the COI between the solved COI and the estimated COI. This period will be the shorter of 5 years and the number of years we need to extrapolate. In our example it is 5 years;
- Calculate a "smoothing factor". This is the difference between the actual COI/qx ratio at the transition point and the result of the regression. In our example the COI/qx calculated from the regression is 0.0003022595853978897 and the COI/qx from the illustration data is 0.00037230523834707539, giving a smoothing factor of -7.0045652949185684E-05.
- Calculate a vector of smoothed COI/qx values. The values prior to the transition point are simply the original COI/qx values. Beyond that point, the values are taken from the COI/qx linear regression. During the transition period, the result of the linear regression is adjusted by the smoothing factor according to what fraction of the transition period has expired. For the first period, we subtract the full smoothing factor, for the next period 4/5 and so on until after 5 periods, the smoothing factor has gone and we are using the result from the linear regression only.
- Calculate COI by multiplying the smoothed COI/qx values by qx.
The end result of this calculation is the smoothed COI shown in the COI table. The process is summarized in the diagram below: